

Comprehensive forest report
Comprehensive forest report
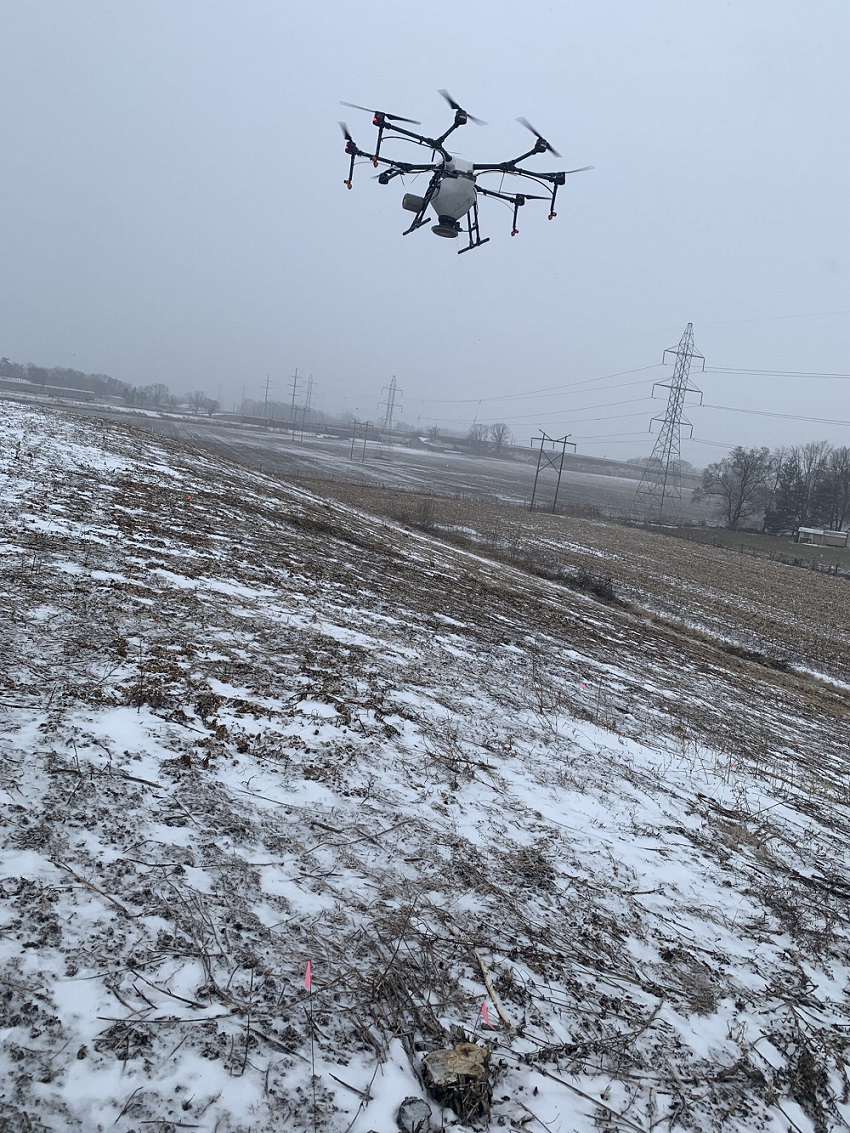
Flown by Phil Woolery, Agriculture & Natural Resource Educator, Purdue Extension – Starke and Pulaski Counties
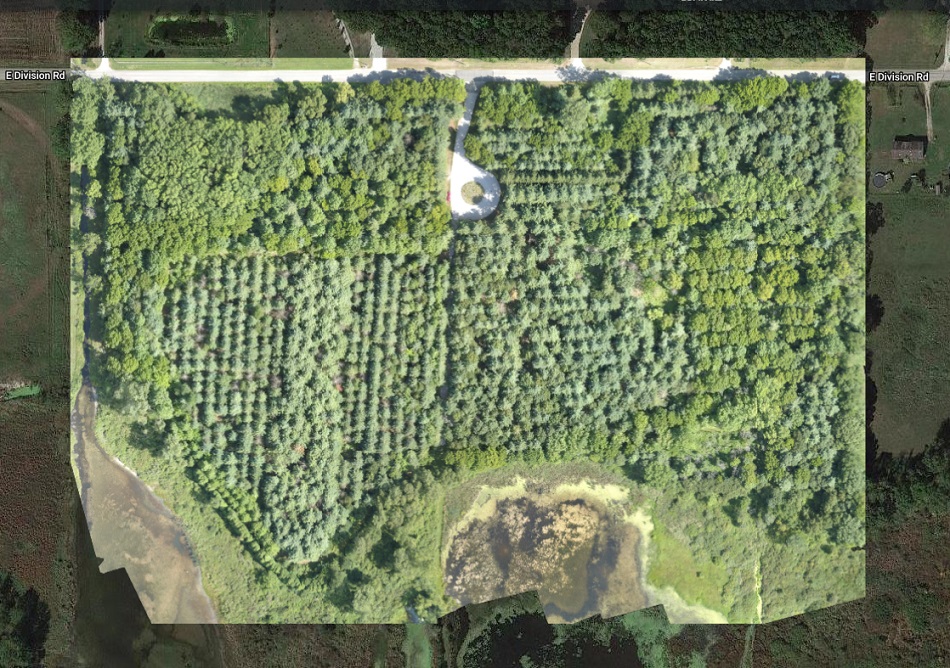
To explore UAV uses in forestry applications, several forests were flown over the course of 2019. One forest had documented history of planting and harvests and flown in two missions in August using a Phantom 4 Pro V2.0 with standard RGB and Sentera Double 4K cameras.
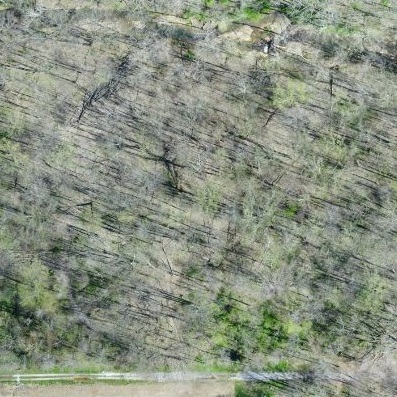
This stitched map was produced of the forest and subsequently analyzed. As you scroll down, you'll see RGB images allow identification of specific tree species upon color and texture.
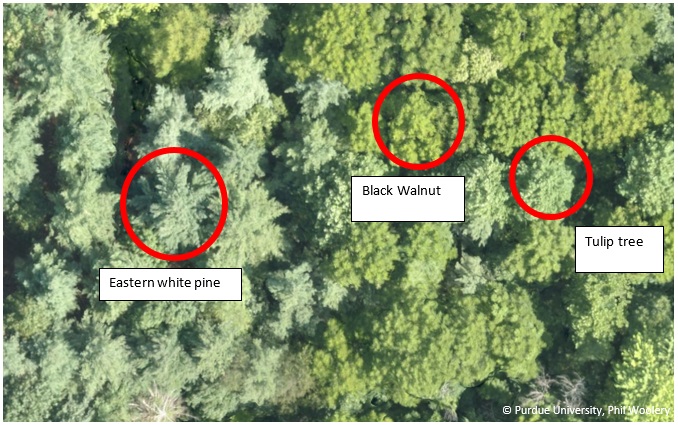 Tree identification
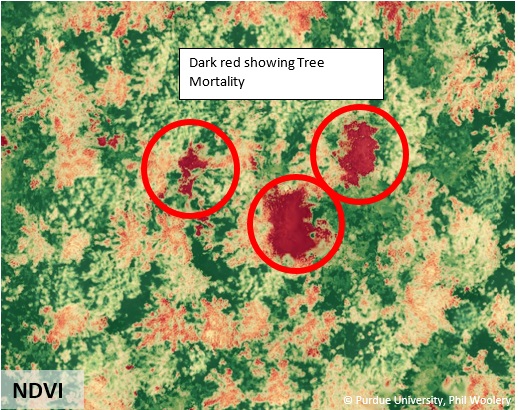
 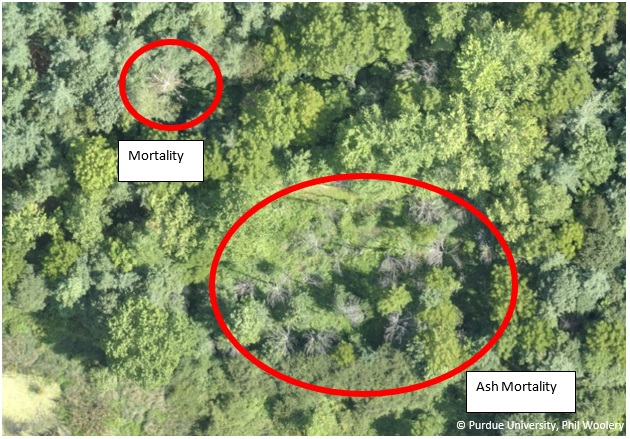 Tree mortality
 Tree stand and growing conditions
By using mapping tools such as the elevation tool in Drone Deply, we get values for total tree heights and location of young and short trees. We can also locate the best growing conditions.
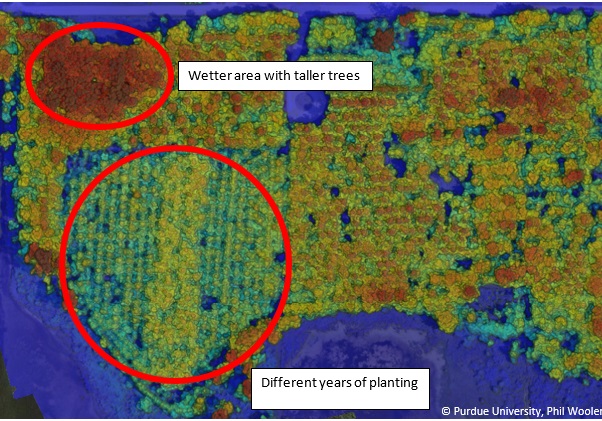
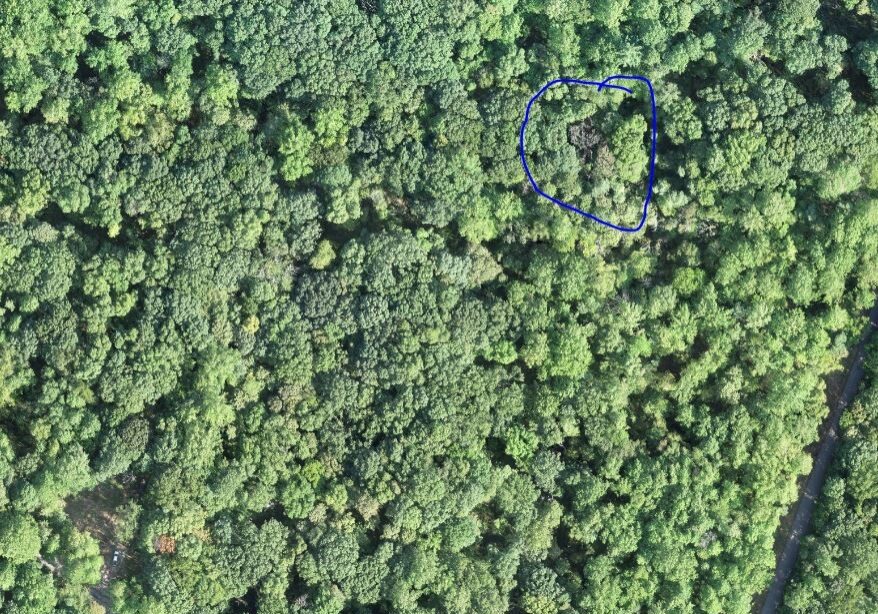
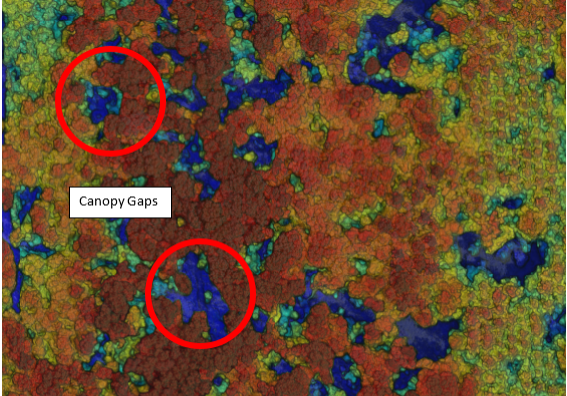 The canopy gaps show up by elevation, and in this instance, are due to a recent timber harvest and sale. This can be useful to compare pre- and post-harvest to evaluate goals.
 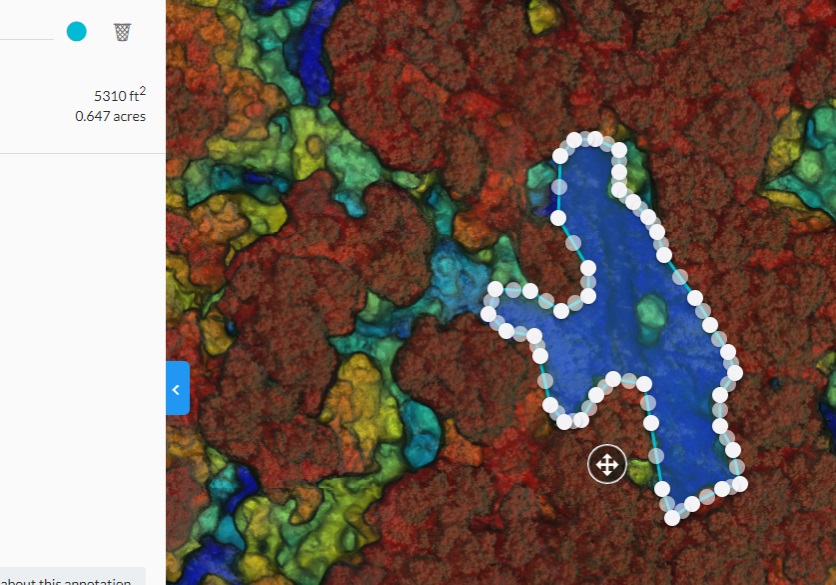 Closeup and map of canopy gap along with square feet.
 Plant health features
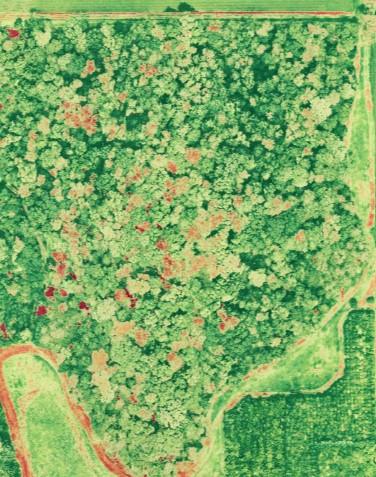
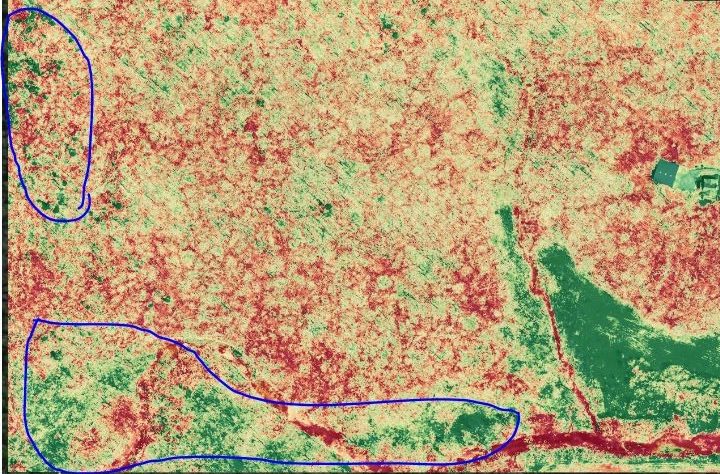
Differences can be seen when comparing plant health maps, such as VARI, NDVI and NDRE.
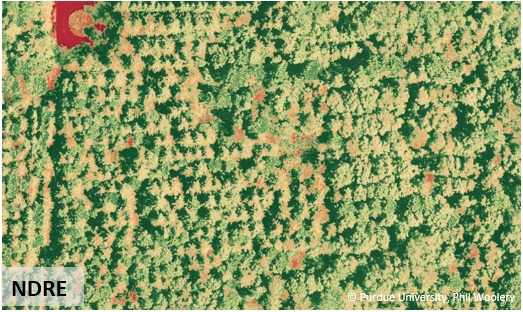
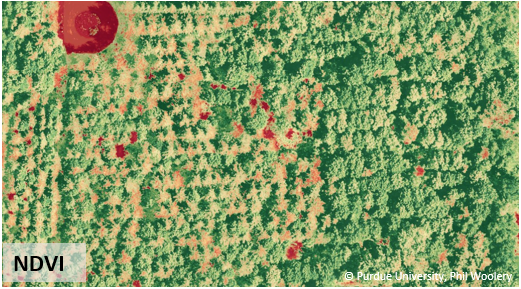
In comparing the three models, we can see similar patterns. The NDVI and NDRE show a few more differences than VARI. All three do a nice job in highlighting trees.
Disease and stress pressure
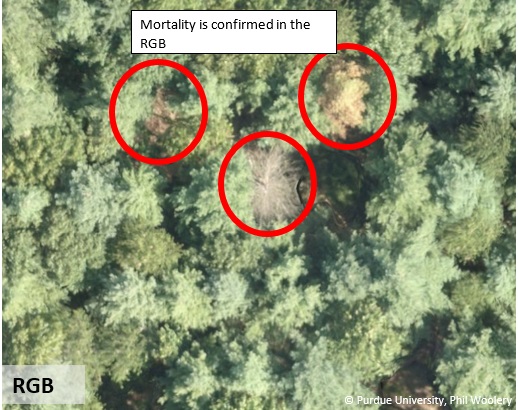
NDVI indicated unhealthy trees in a few instances, while the RGB did not indicate any obvious sign of stress or disease.
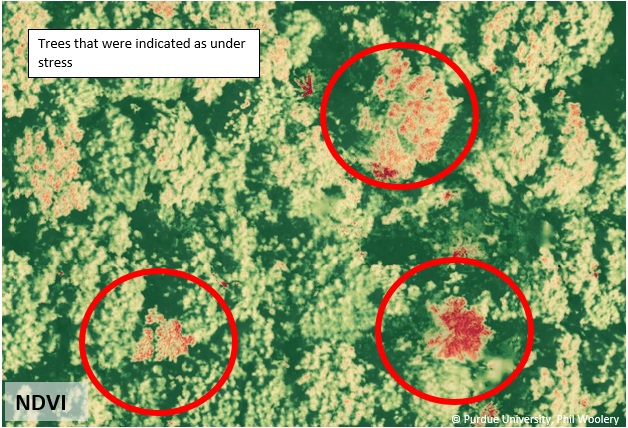
Ground truthing:
Several of the trees were checked by ground in September. Overall, it appears the NDVI is doing a good job pinpointing stress. Further investigation will evaluate potential disease spotting and susceptibility in tree breeding.
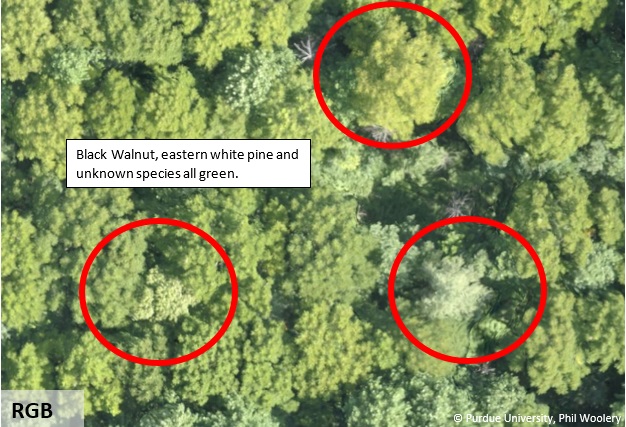
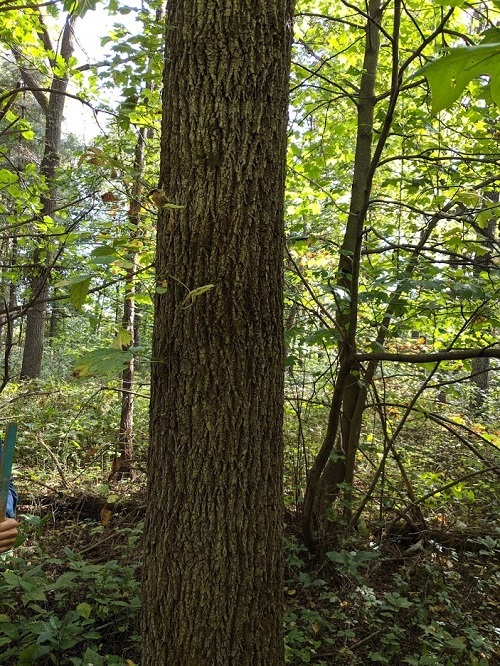
A black walnut was planted 33 years ago with a diameter of 14 inches – a growth rate of about a half inch per year. The crown looked large and healthy. This particular tree showed signs of stress in the NDVI map, but may be a result of growth pattern. Vigorous growing black walnut trees will continue growth late into the summer, and the new growth may be a result of the NDVI data.
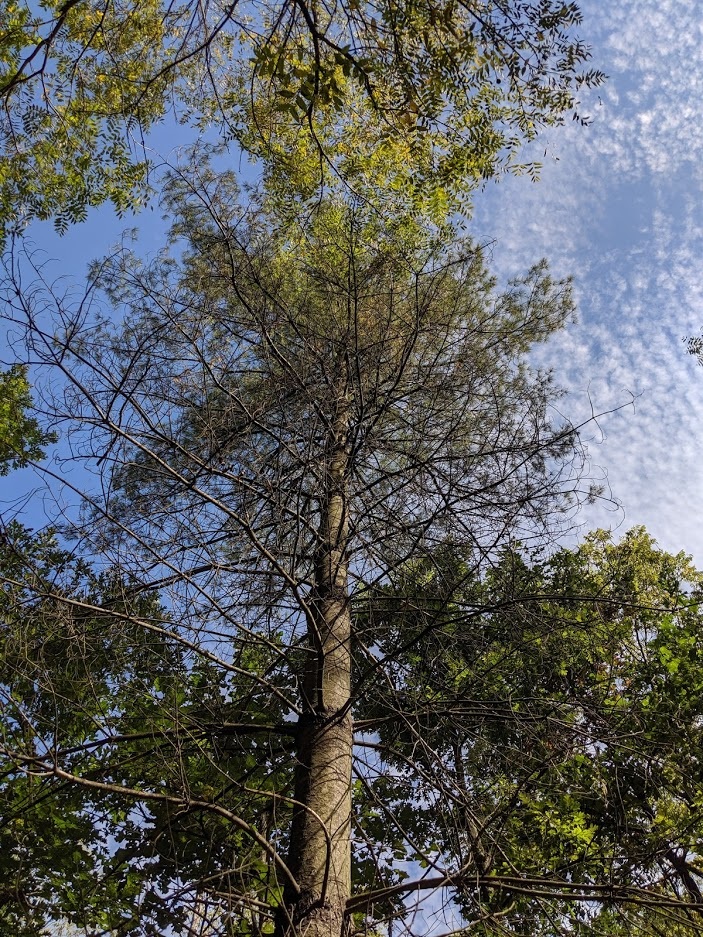 The eastern white pine in this photo showed signs of stress in the NDVI. It’s likely suffering from allelopathy from the black walnut.
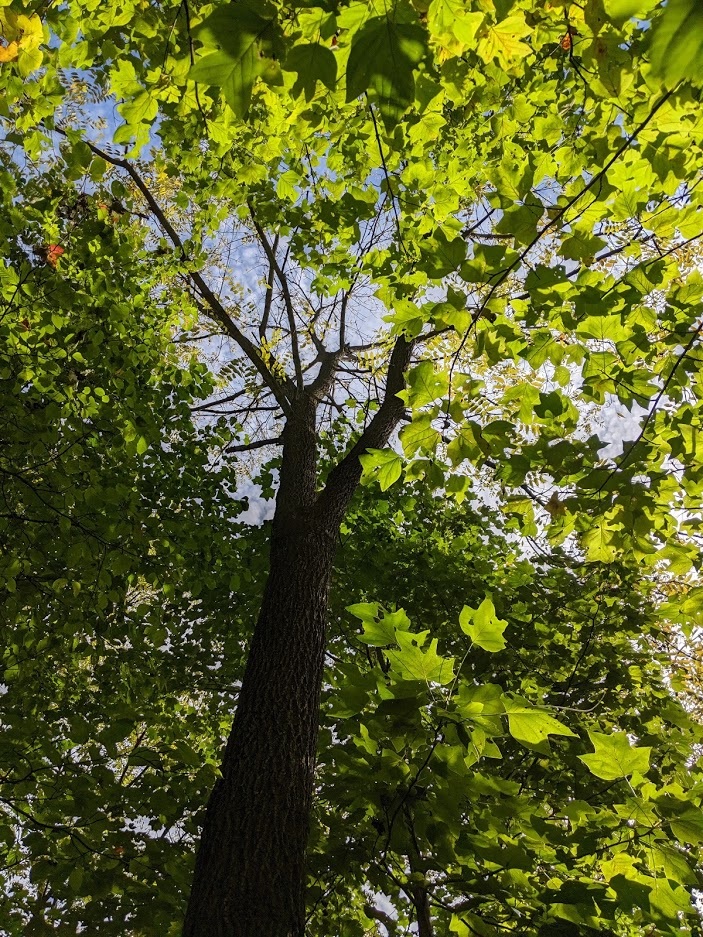
The third tree identified is a hackberry. It appeared healthy but was in a suppressed canopy position. It could be the leaf color that indicated stress in the NDVI.
The eastern white pine in this photo showed signs of stress in the NDVI. It’s likely suffering from allelopathy from the black walnut.
The third tree identified is a hackberry. It appeared healthy but was in a suppressed canopy position. It could be the leaf color that indicated stress in the NDVI. Natural Resources Examples
A demonstration trial of methods to control the invasive winged burning bush was conducted in the...
This project was completed at Ivy Tech in Lafayette, Indiana and in collaboration with Ivy Tech...
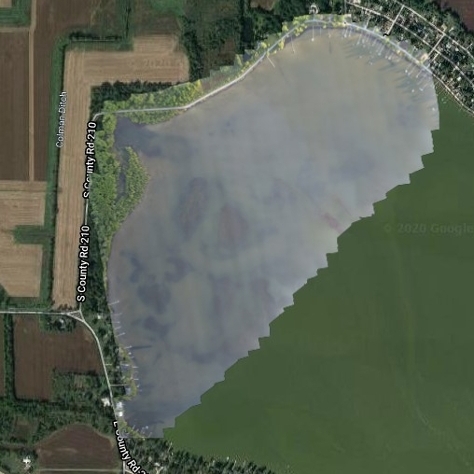
Bass Lake is a 1,345-acre lake in Starke County, Indiana and has problems with invasive Eurasian...
This project was initiated to create a State Parks Virtual Field Trip program, geared for use in...
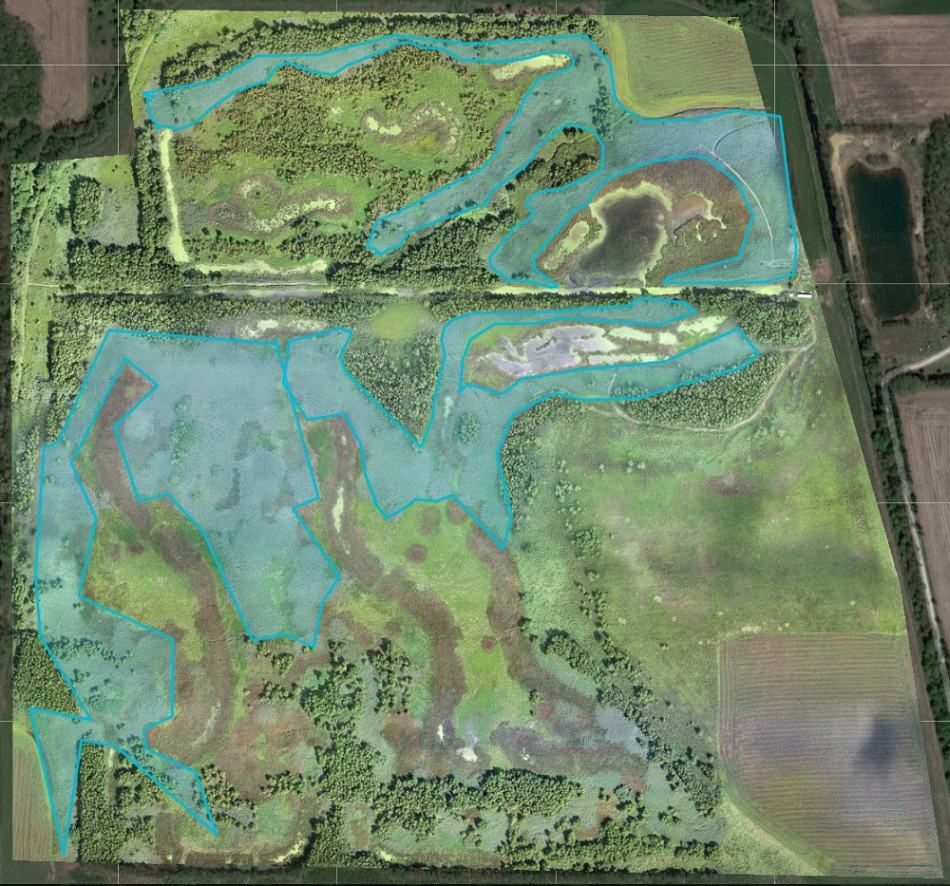
Common reed (Phragmites australis) is an Indiana native, but invasive, weed. It’s...
UAV use in wooded areas can identify invasive plant species for removal along as well as track...
Invasive species control flights provided wood rating for EQIP application in partnership Ripley...
UAVs were used to locate known trees at Southeast Purdue Agricultural Center (SEPAC) affected by...
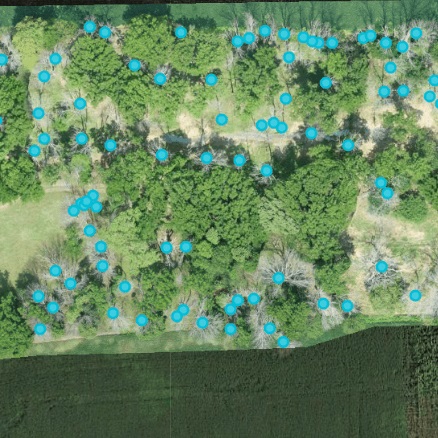
The Emerald Ash Borer killed all dead trees in this orthomosaic image. This woodlot is...
To explore UAV uses in forestry applications, several forests were flown over the course of 2019....