

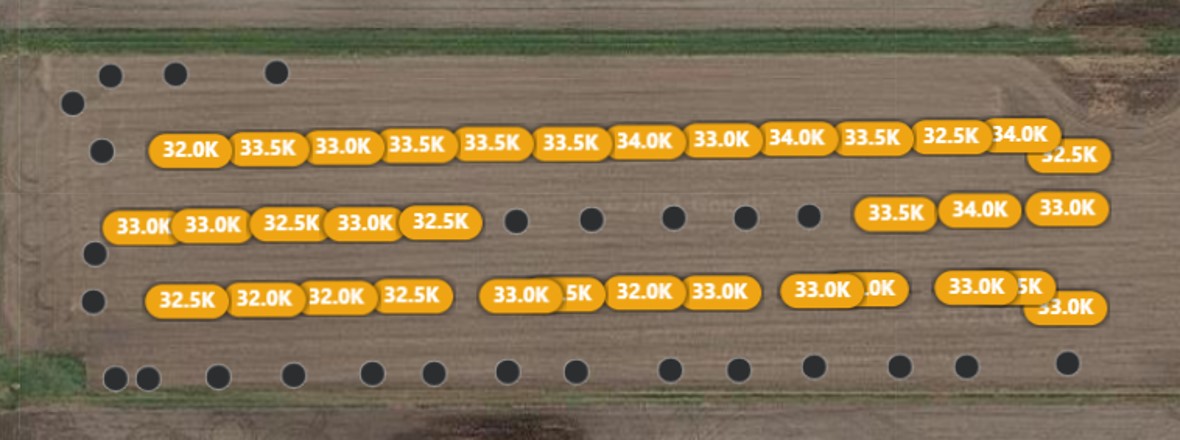
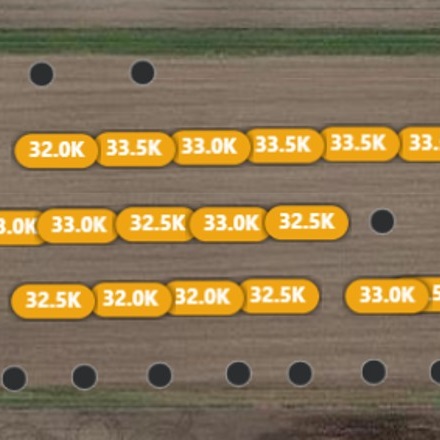
Improved algorithms for corn stand assessment
Flown by John Scott, Digital Agriculture Extension Coordinator, Purdue Extension
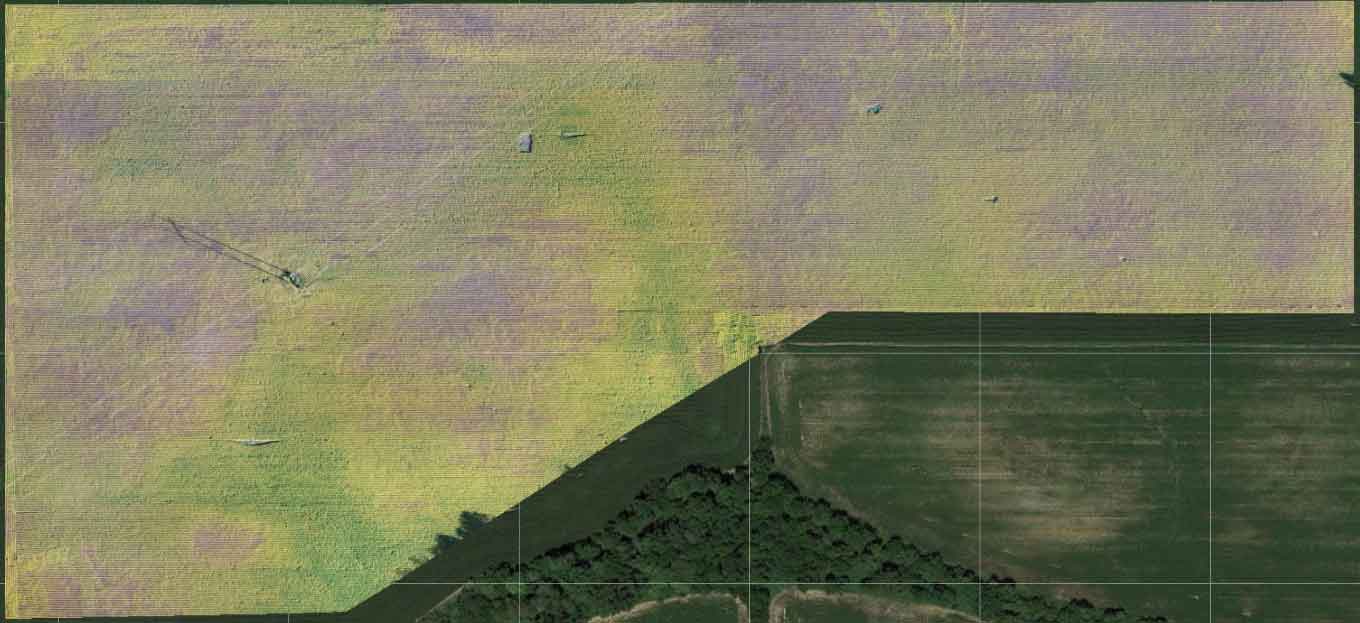
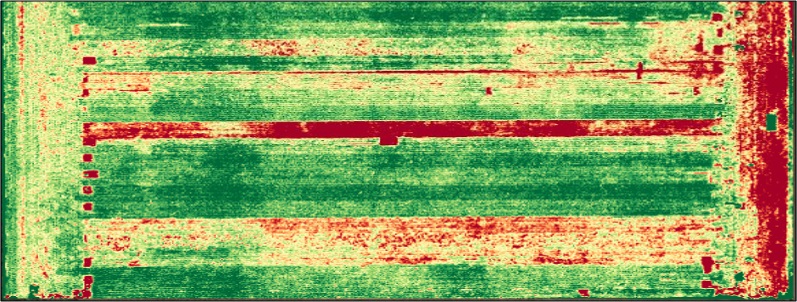
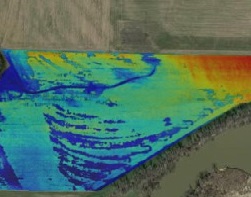
Three plant health maps were compared alongside RGB to determine if additional sensors would result in a complete map for better decision-making. While the NDVI appears to showcase the most detail, we still need to conduct more research and ground-truthing. We will continue exploring different plant health indices to see how each tool fits into management strategies.
Corn, Soybean and Wheat Examples
Three plant health maps were compared alongside RGB to determine if additional sensors...

Three plant health maps were compared alongside RGB to determine if additional sensors would...
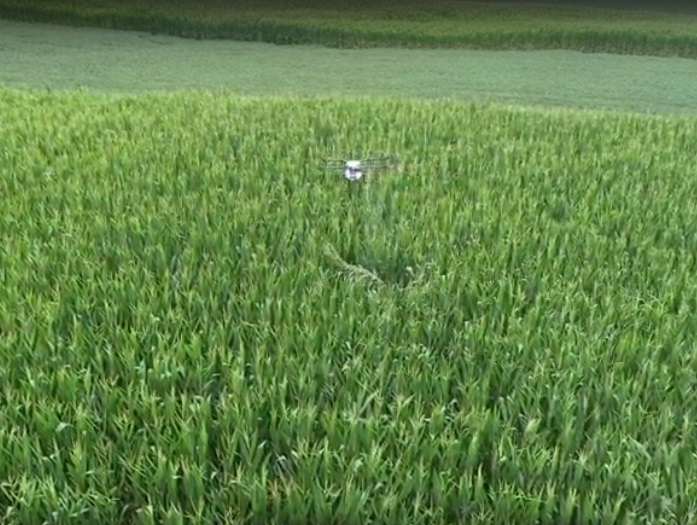
This DJI Agras spray drone is designed for precision variable rate application of liquid...
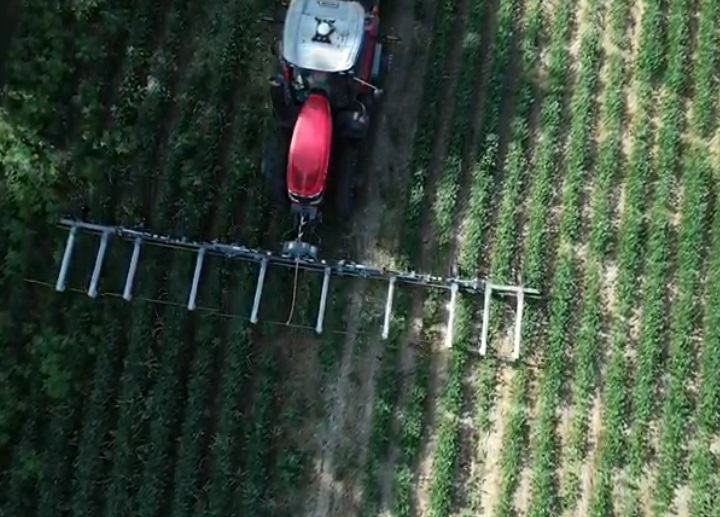
A non-chemical weed suppression technique using electricity to boil water in plant cells causes...
Flame weeding is a practice that organic farmers can use to control grass and broadleaf weeds in...
A severe storm passed through White County, Ind. in July 2020, causing...
Premature leaf drop triggered the detection of the fungus Cercospora kikuchii which attacks...
Tar spot was discovered at a Purdue irrigation research plot and monitored by Darcy Telenko,...

A Warren County farmer was interested in understanding differences between tillage, other field...
The red streak in the middle of this field near the Ivy Tech Community College site in Lafayette...
A map series was generated during testing of the Quantix fixed-wing UAV in 2019. The fixed-wing...
Flown May 2018 by Mark Carter, Agriculture & Natural Resources Educator, Purdue Extension...
Pattern tile installation occurred on this field during winter 2020-21 with 50-foot lateral spans...
Drones are not only effective at recording plant health, but also at detecting how land features...
Warm and dry falls can result in loss of crops and equipment due to fires. In this case, we look...