

Highlighter green soybeans and field management
Flown by Jon Charlesworth, Agriculture & Natural Resources Educator, Purdue Extension – Benton/Warren County
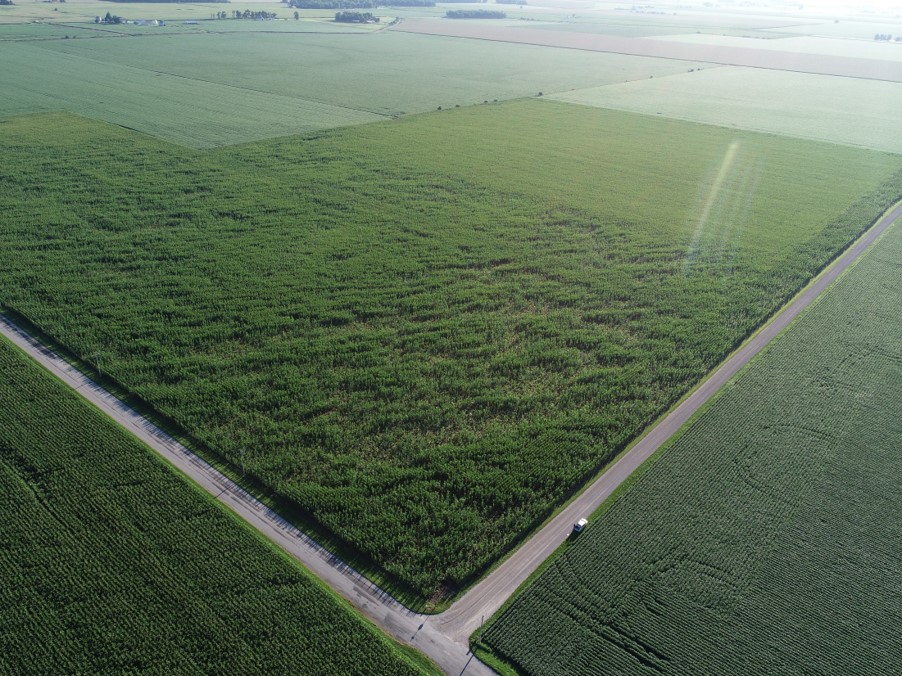
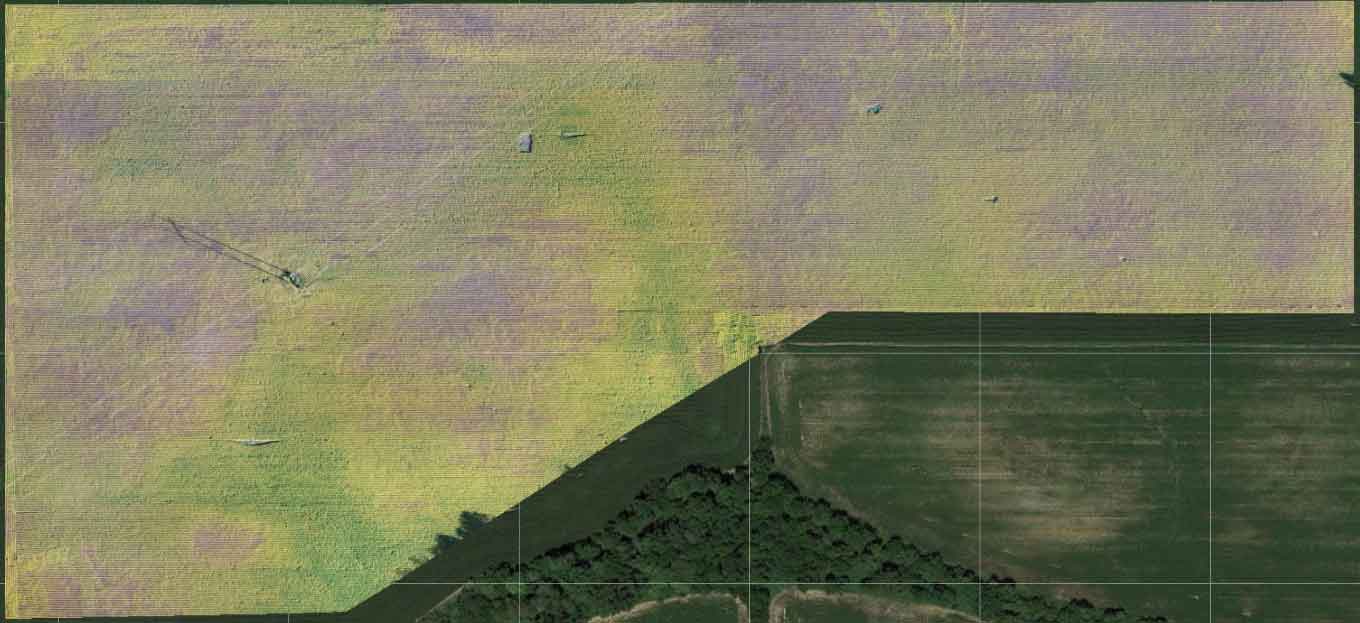
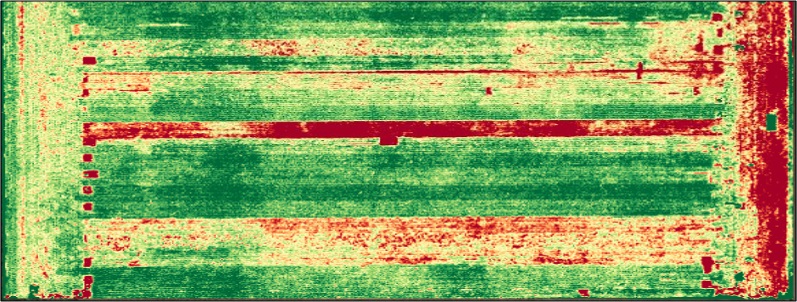
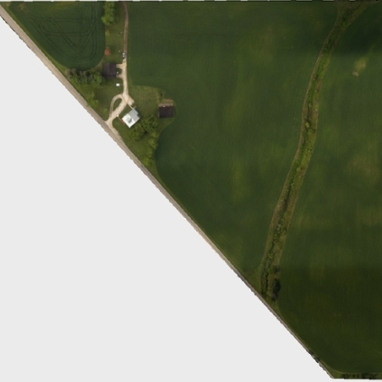
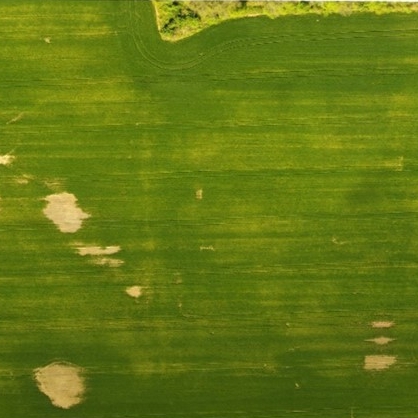
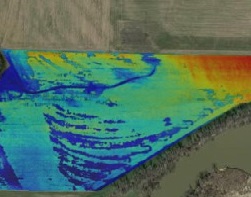
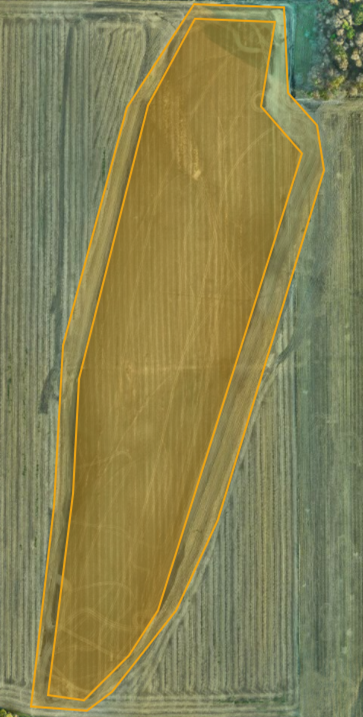
A Warren County farmer was interested in understanding differences between tillage, other field operations, cover crop and fertilizer amendments using crop health maps. Below are the stitched RGB and NDVI (crop health) maps of the field taken around stage R3. Like many soybean fields in Warren County, the plants had suffered through an extremely wet June and early July. Many of the plants were yellow and stunted.
It was obvious from the patterns in these maps that soybeans directly over drainage tile lines were healthier than plants in between tile lines. There is a definite demarcation line located about two-thirds of the way through the field when moving from North to South. The general health of the soybeans in the southern one-third of the field is considerably better than in the northern two-thirds of the field. The maps were shared with the producer and follow-up occurred after harvest to discuss the value of the imagery.
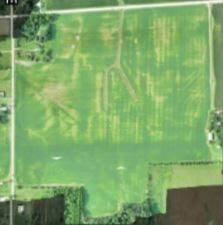 RGB
RGB  NDVI
NDVI Corn, Soybean and Wheat Examples
Three plant health maps were compared alongside RGB to determine if additional sensors...

Three plant health maps were compared alongside RGB to determine if additional sensors would...
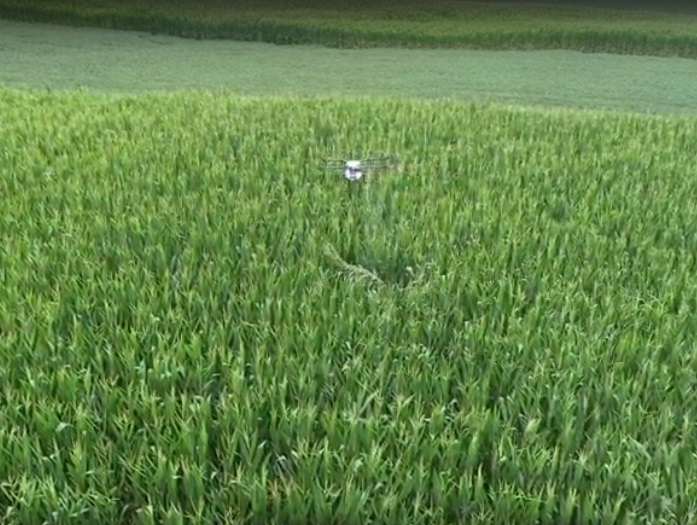
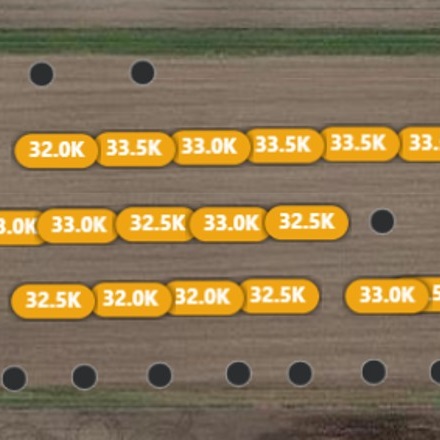
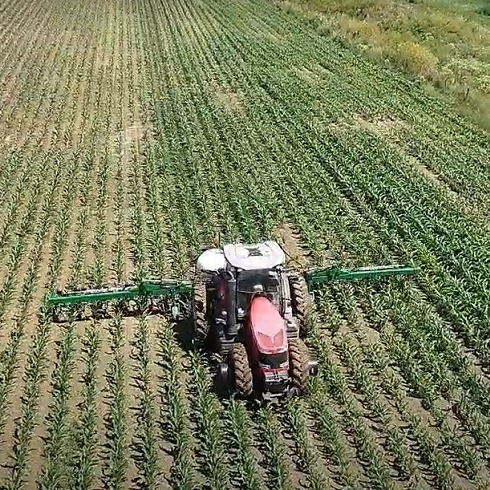
This DJI Agras spray drone is designed for precision variable rate application of liquid...
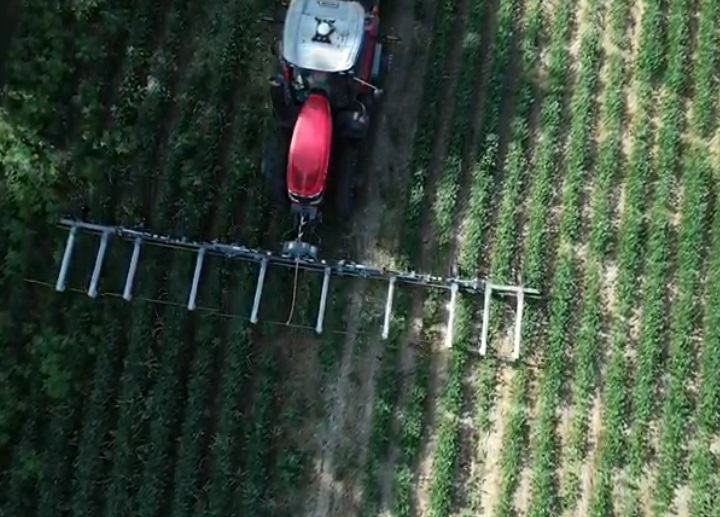
A non-chemical weed suppression technique using electricity to boil water in plant cells causes...
Flame weeding is a practice that organic farmers can use to control grass and broadleaf weeds in...
A severe storm passed through White County, Ind. in July 2020, causing...
Premature leaf drop triggered the detection of the fungus Cercospora kikuchii which attacks...
Tar spot was discovered at a Purdue irrigation research plot and monitored by Darcy Telenko,...
A Warren County farmer was interested in understanding differences between tillage, other field...
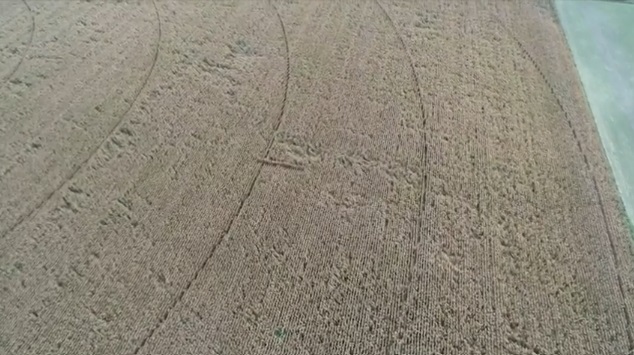
The red streak in the middle of this field near the Ivy Tech Community College site in Lafayette...
A map series was generated during testing of the Quantix fixed-wing UAV in 2019. The fixed-wing...
Flown May 2018 by Mark Carter, Agriculture & Natural Resources Educator, Purdue Extension...
Pattern tile installation occurred on this field during winter 2020-21 with 50-foot lateral spans...
Drones are not only effective at recording plant health, but also at detecting how land features...
Warm and dry falls can result in loss of crops and equipment due to fires. In this case, we look...