Heat Forecast Tools Explained
Source: National Weather Service
Very hot conditions are forecasted for most of the upcoming week. With that forecast we’ll be hearing the terms “heat index”, “heat risk”, and even “Wet Bulb Globe Temperature” from meteorologists on our local news a lot in the coming days. To better understand these terms, the National Weather Service has prepared the following article that discusses each in detail:
NWS has multiple tools to assess the potential for heat stress due to extreme temperatures. The following tools can inform the issuance of NWS official heat watches, warnings, and advisories. Each of these tools integrate other weather parameters to provide a deeper level of information beyond what the actual air temperature can tell us.
Heat Index
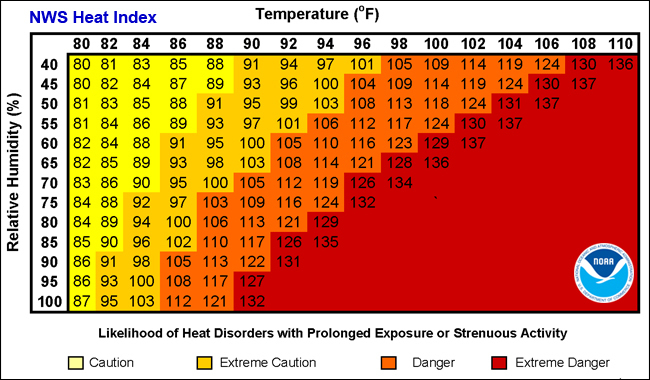
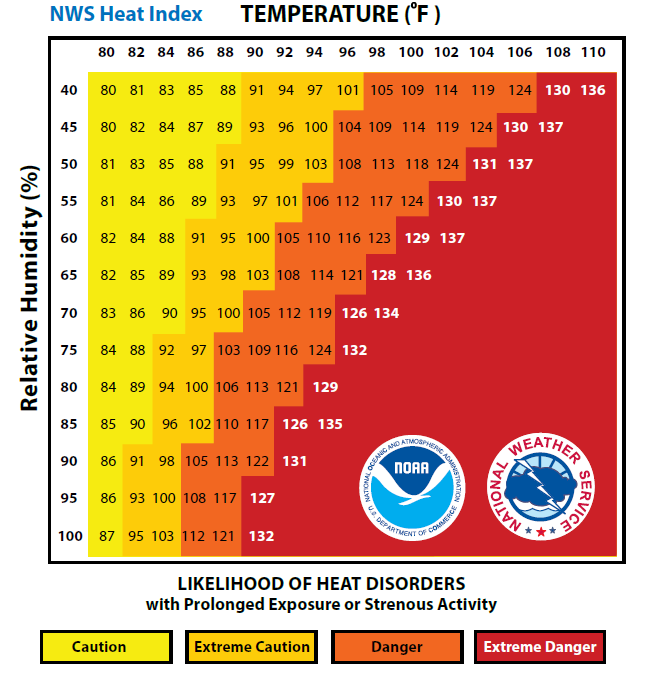
The Heat Index is a measure of how hot it really feels when relative humidity is factored in with the actual air temperature. To find the Heat Index temperature, look at the Heat Index Chart above or check our Heat Index Calculator. As an example, if the air temperature is 96°F and the relative humidity is 65%, the heat index–how hot it feels–is 121°F. The red area without numbers indicates extreme danger. The National Weather Service will initiate alert procedures when the Heat Index is expected to exceed 105°-110°F (depending on local climate) for at least 2 consecutive days.
NWS also offers a Heat Index chart for areas with high heat but low relative humidity. Since heat index values were devised for shady, light wind conditions, exposure to full sunshine can increase heat index values by up to 15°F. Also, strong winds, particularly with very hot, dry air, can be extremely hazardous.
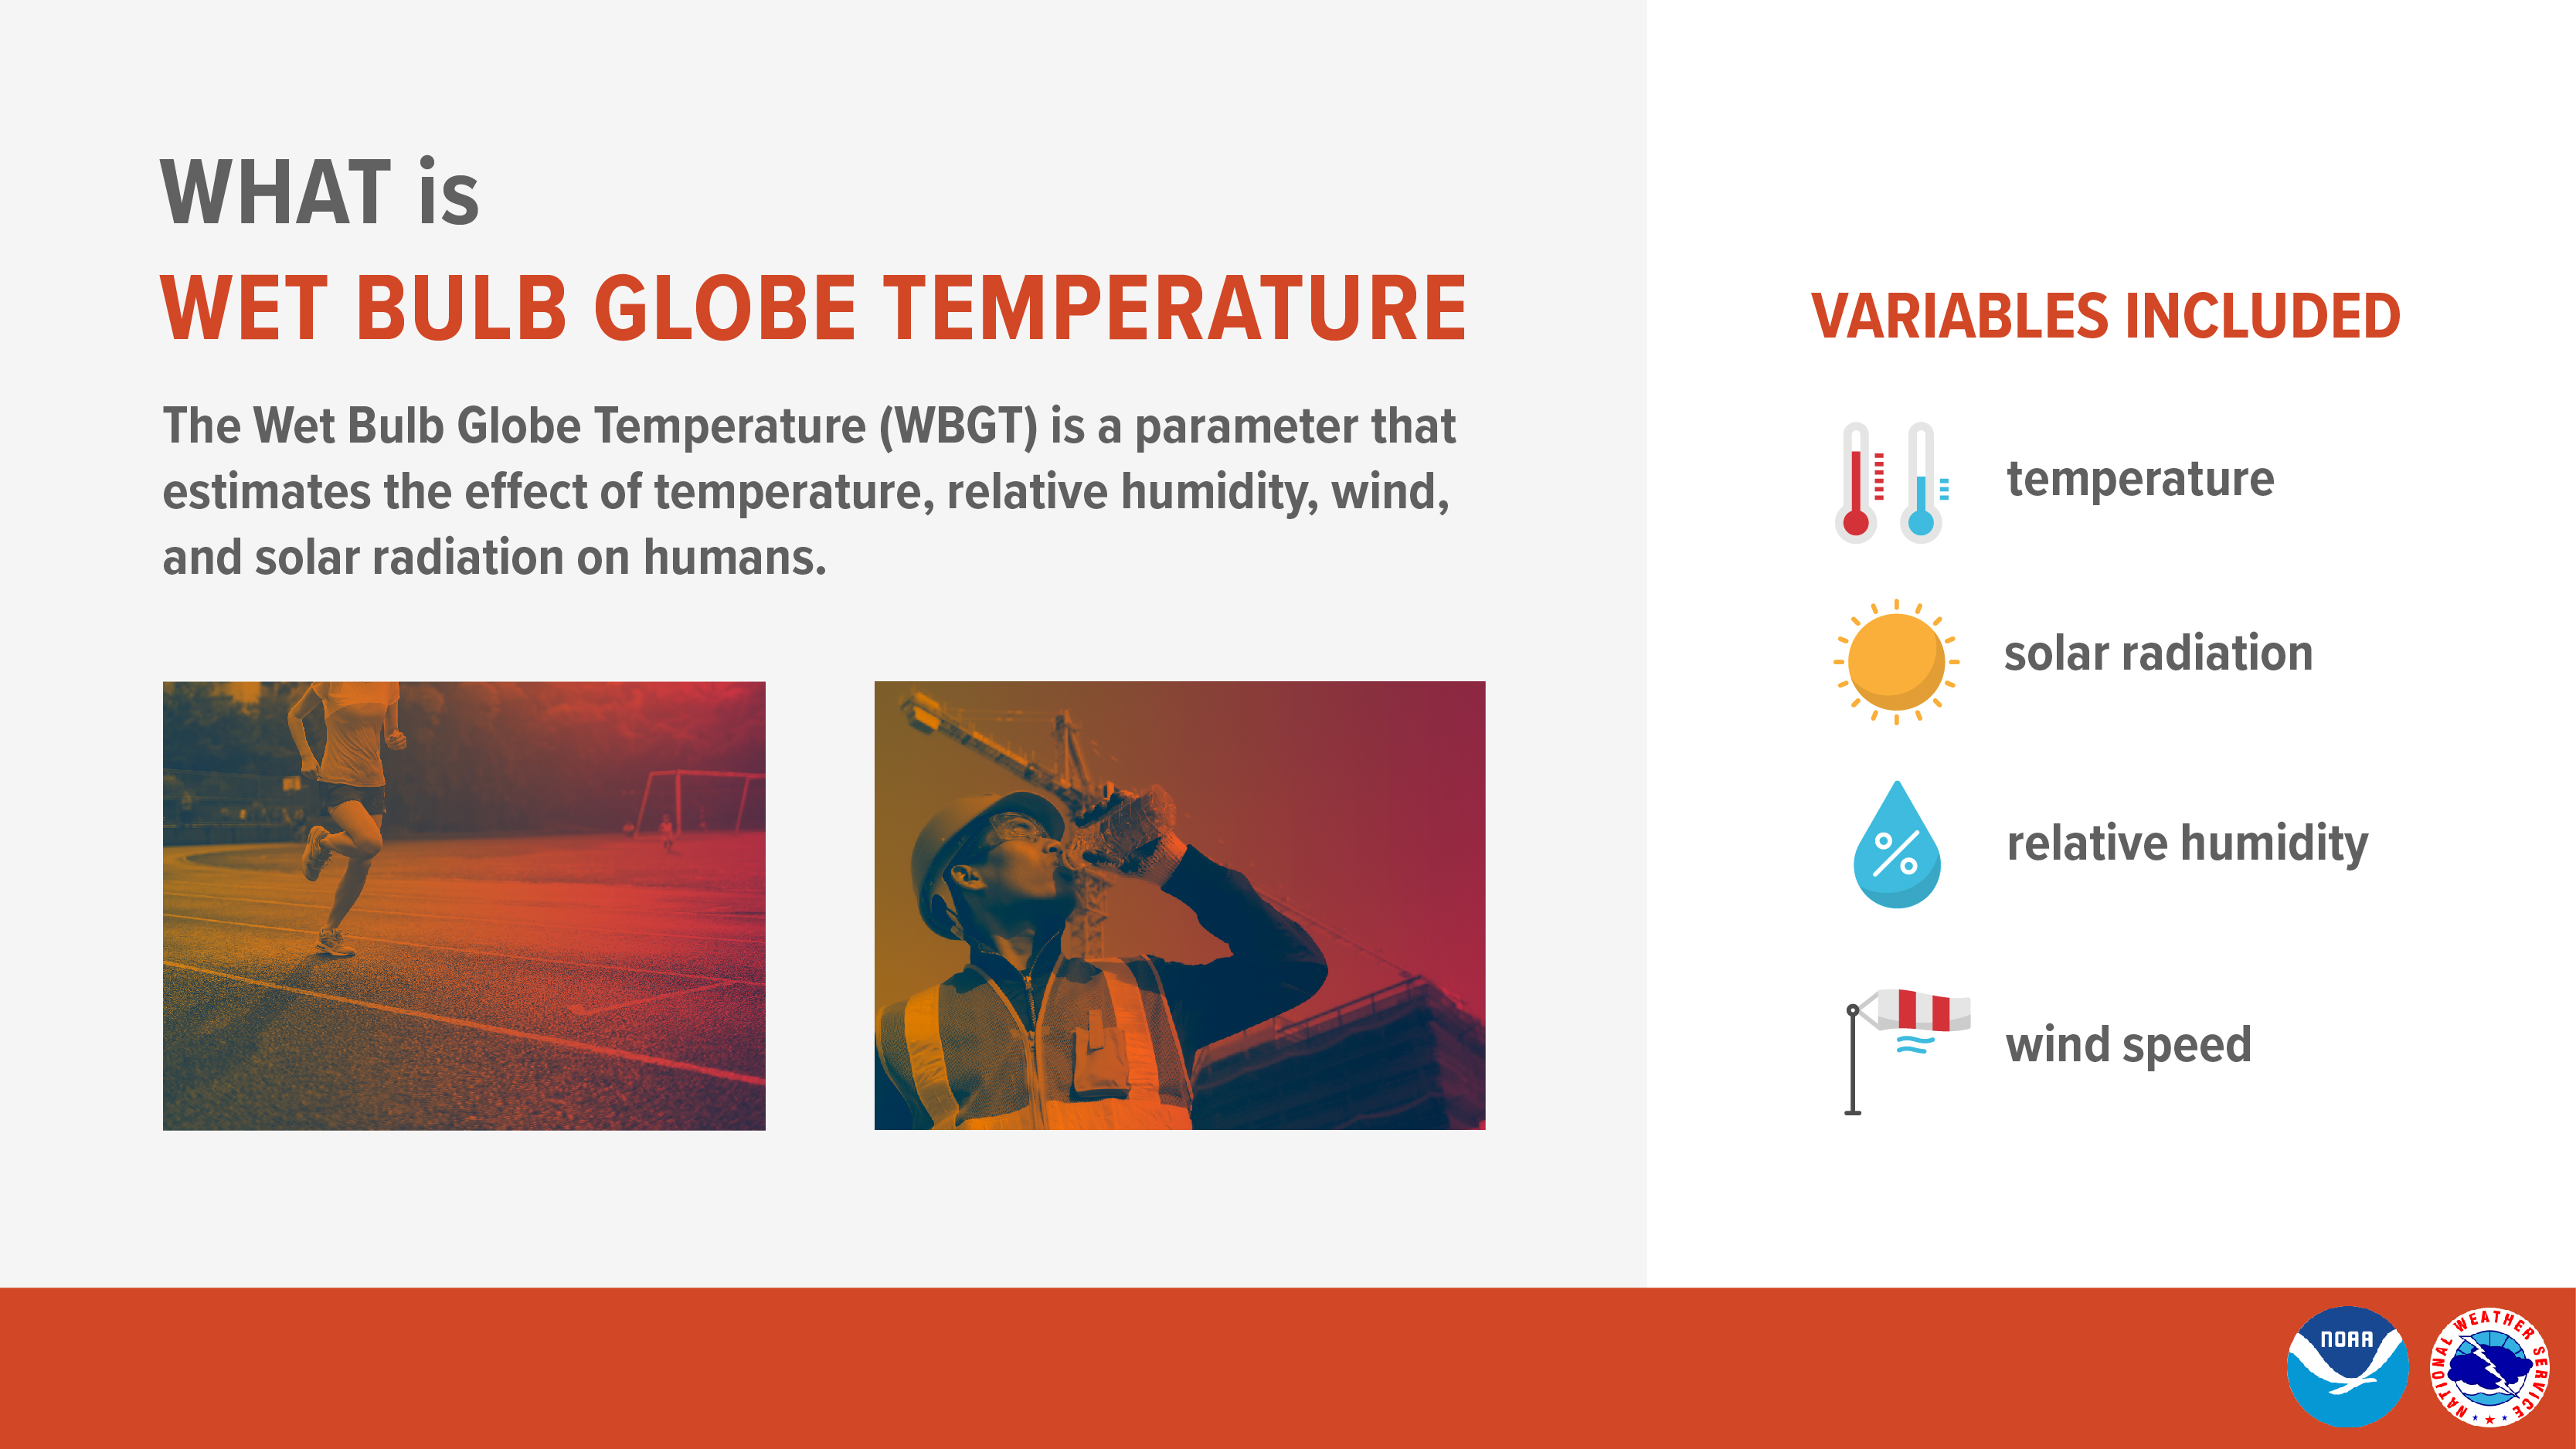
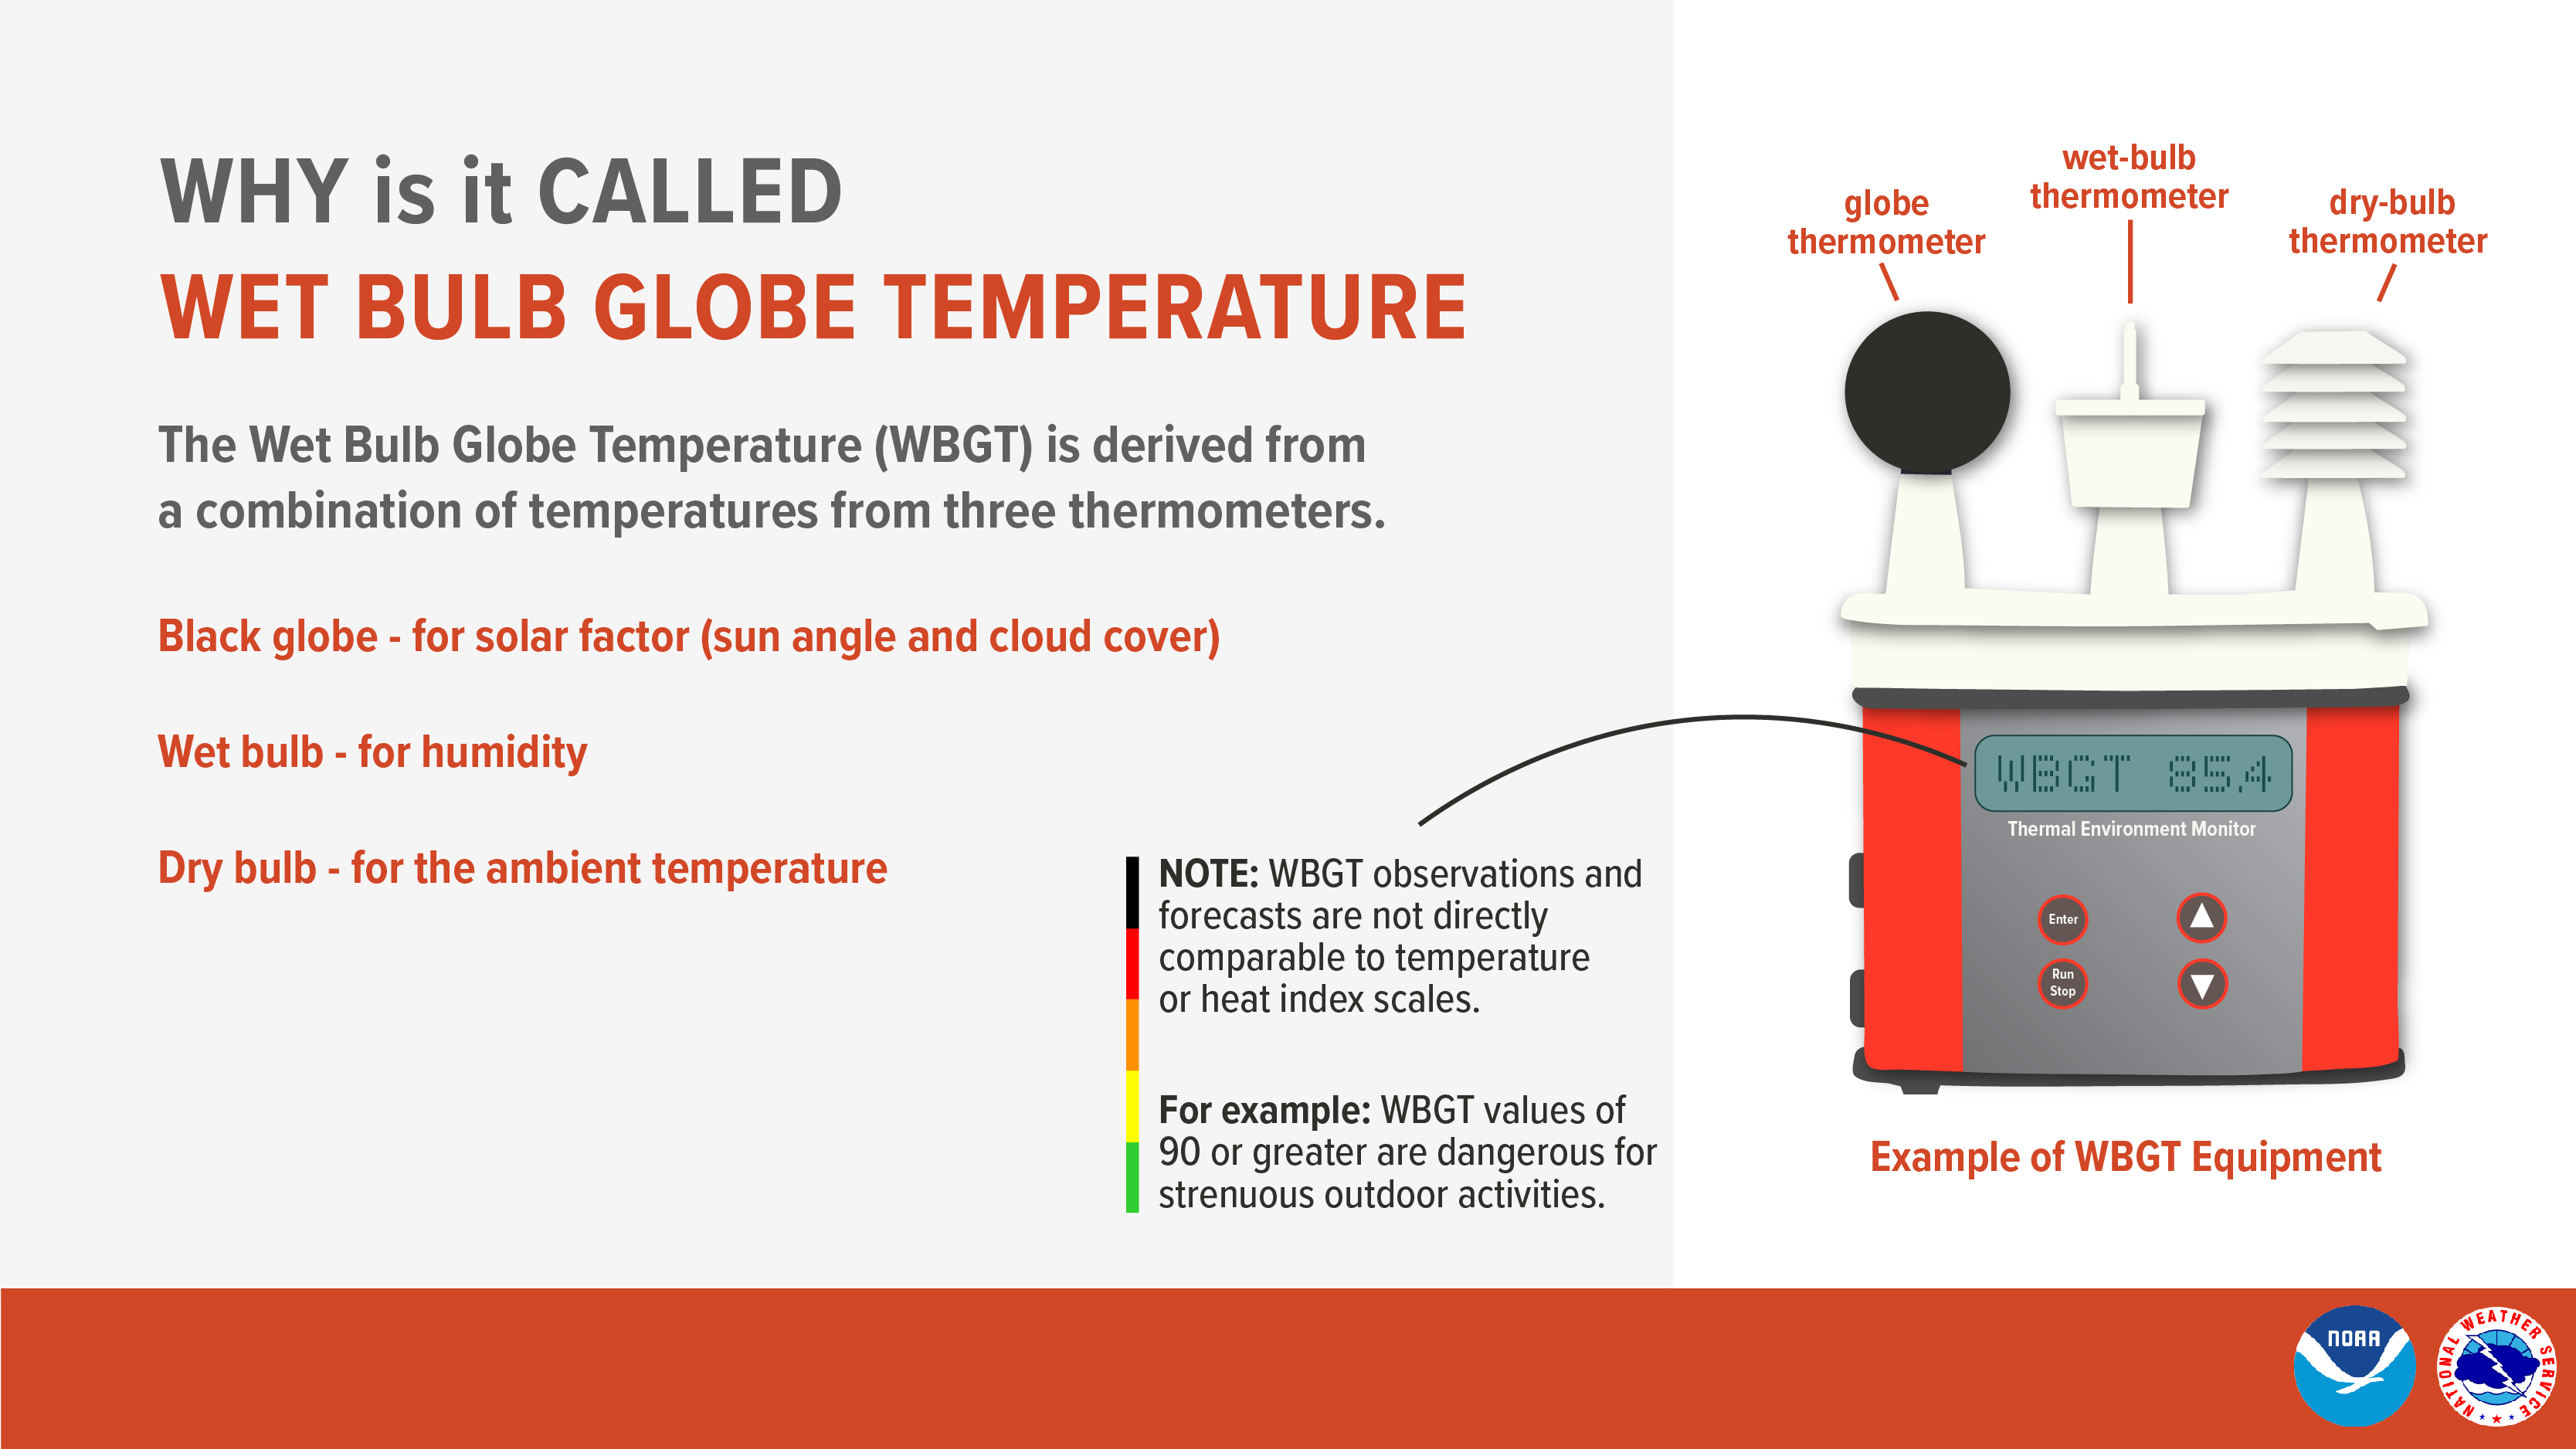
Wet Bulb Globe Temperature (WBGT)
What is Wet Bulb Globe Temperature (WBGT)? Check out this handout and video to learn about WBGT.
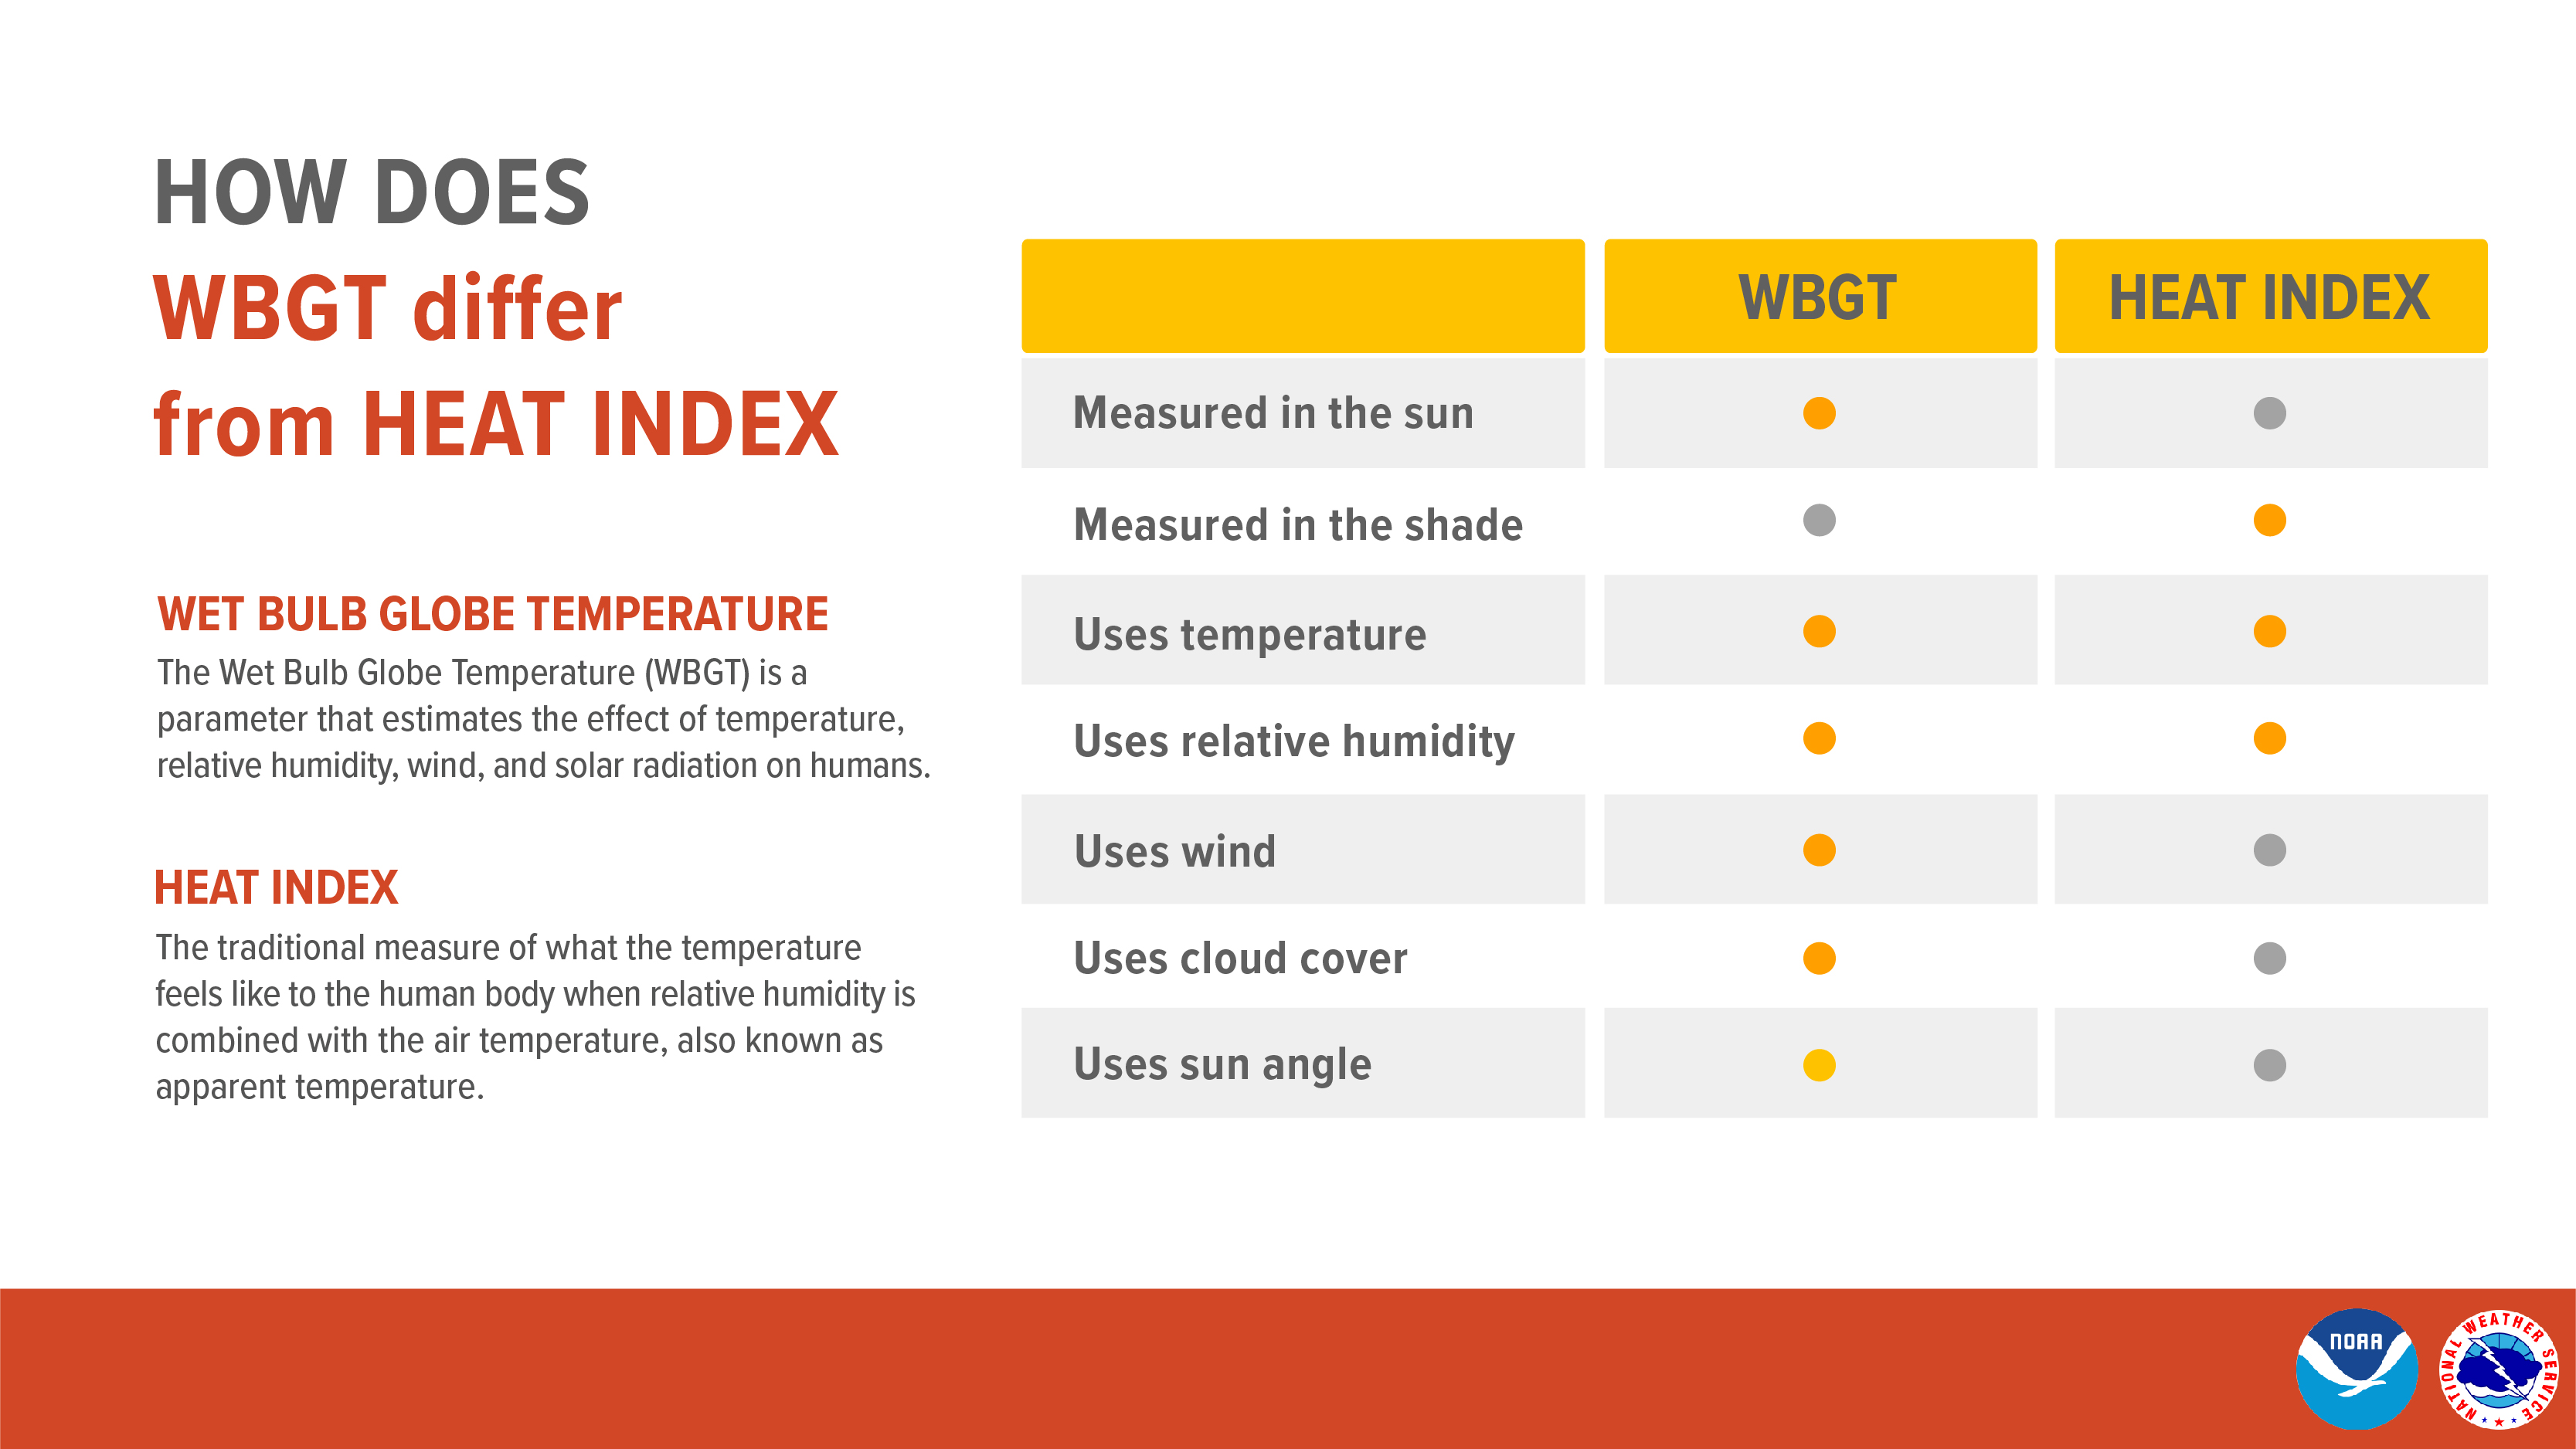
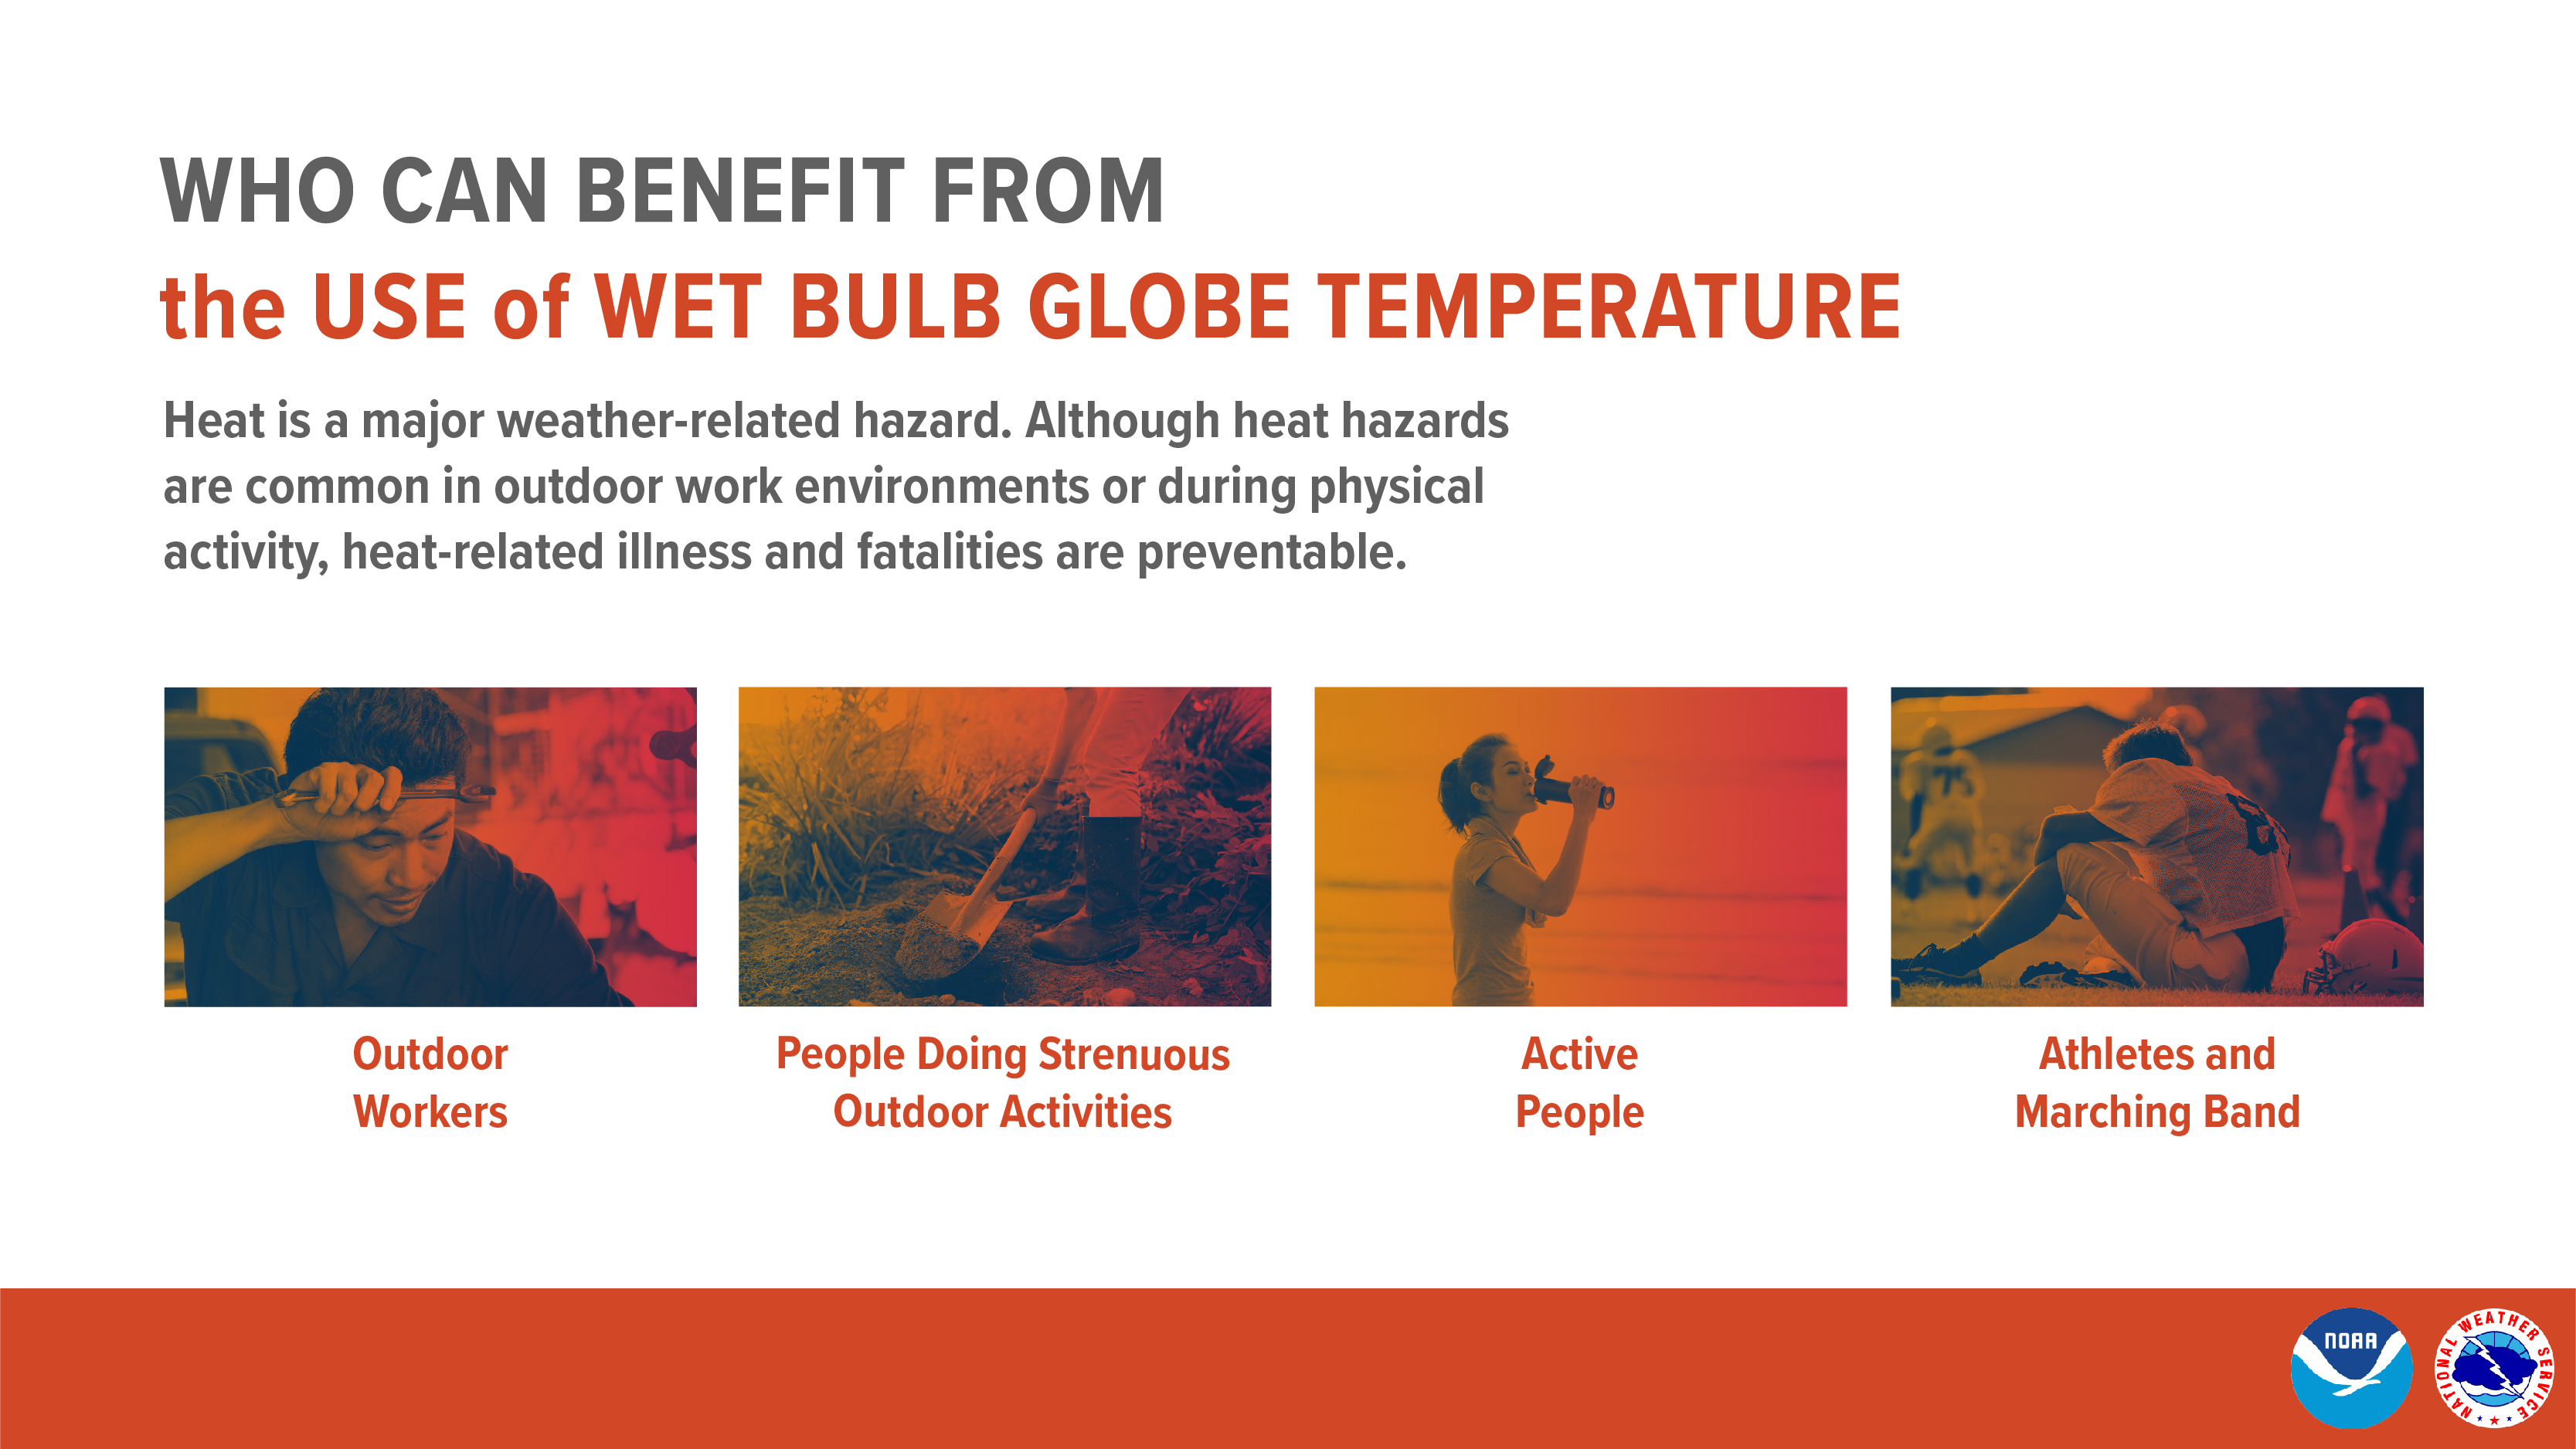
WBGT uses temperature, humidity, wind, solar radiation, and other weather parameters. It’s a particularly effective indicator of heat stress for active populations such as outdoor workers and athletes.
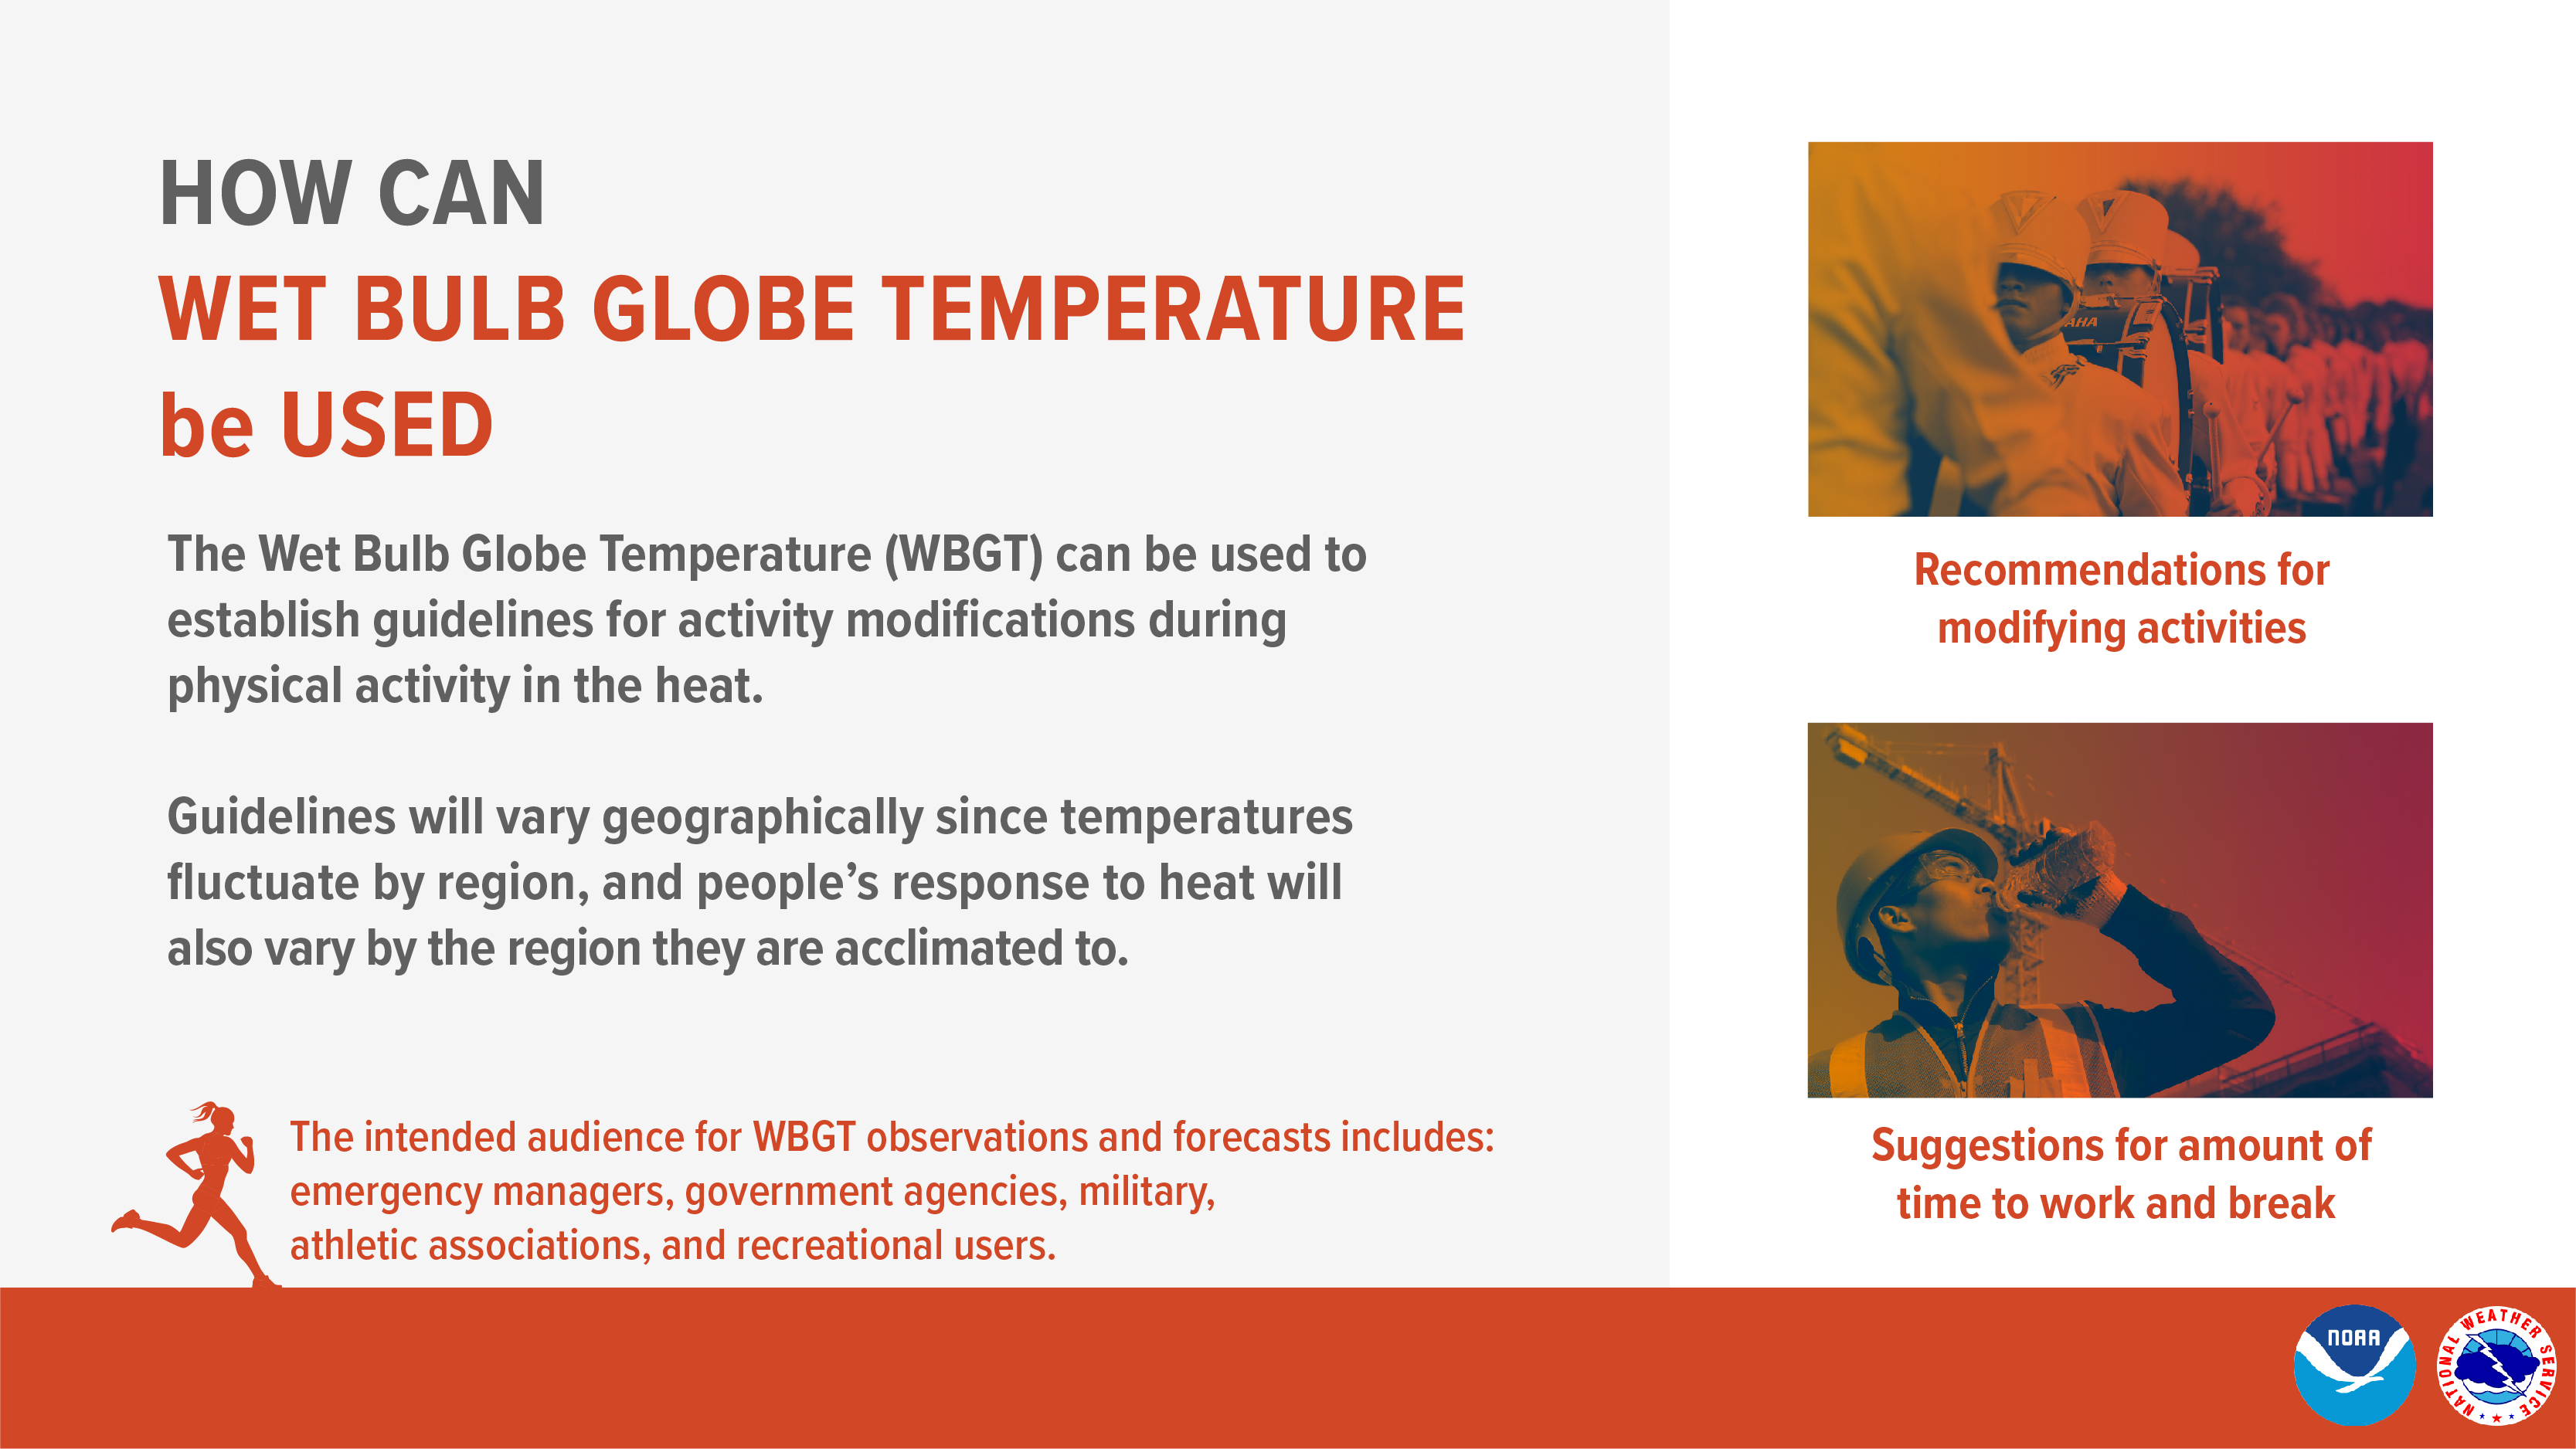
WBGT can be used to inform activity modifications during exercise or outdoor work. For instance, The American College of Sports Medicine bases its guidelines for the intensity of sport practices on WBGT, and it is therefore utilized by athletic programs in many school districts.
The Occupational Safety and Health Administration (OSHA) recommends protective measures for outdoor work:
- Acclimatize workers starting the first day working in the heat and after any extended absences
- Provide shade for outdoor work sites
- Schedule work earlier or later in the day
- Use work/rest schedules
- Limit strenuous work (eg., carrying heavy loads)
- Use relief workers when needed
For more information:
- WBGT Forecast
- WBGT Informational Guide
- Why is it called Wet Bulb Globe Temperature?
- How does WBGT differ from Heat Index?
- How can Wet Bulb Globe Temperature be used?
- Who can benefit from the use of Wet Bulb Globe Temperature?

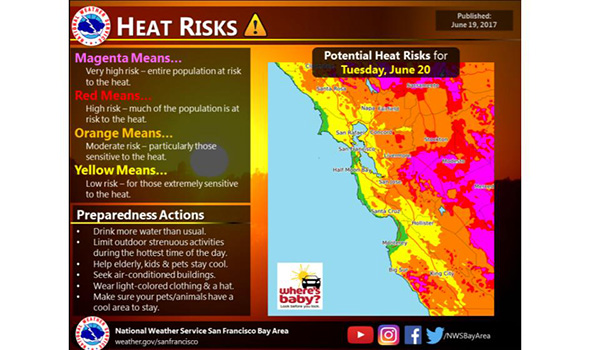
Heat Risk
- The National Weather Service (NWS) prototype HeatRisk forecast provides a color and numeric value that places forecast heat for a specific location into an appropriate level of heat concern, along with identifying groups potentially most at risk at that level. The HeatRisk is accompanied by recommendations for heat protection and is a useful tool for planning for upcoming heat and its associated potential risk.
- Based on the high resolution NWS national gridded forecast database, a daily HeatRisk value is calculated for each location from the current date through seven days in the future.
- The HeatRisk takes into consideration:
- How significantly above normal the temperatures are at your location,
- the time of the year (for example, is this early season heat that you likely haven’t become used to, or late season heat that you have become more used to),
- Duration of unusual heat (for example, are temperatures overnight at levels that would lower heat stress, or will warm overnight low temperatures continue to add to heat stress into the next day), and
- If those temperatures are at levels that pose an elevated risk for heat complications, such as heat stress, based on peer reviewed science.
- While humidity is not directly taken into account, an approximation is used by considering:
- How unusually warm the overnight temperatures are (more humid air usually leads to warmer overnight low temperatures than are typical for an area)
- How large the difference is between overnight lows and daytime high temperatures (the difference tends to be smaller the more humid the air is).