

Grassed waterway management
Flown by Jon Charlesworth, Agriculture & Natural Resources Educator, 4-H Youth Development, Purdue Extension - Benton/Warren County
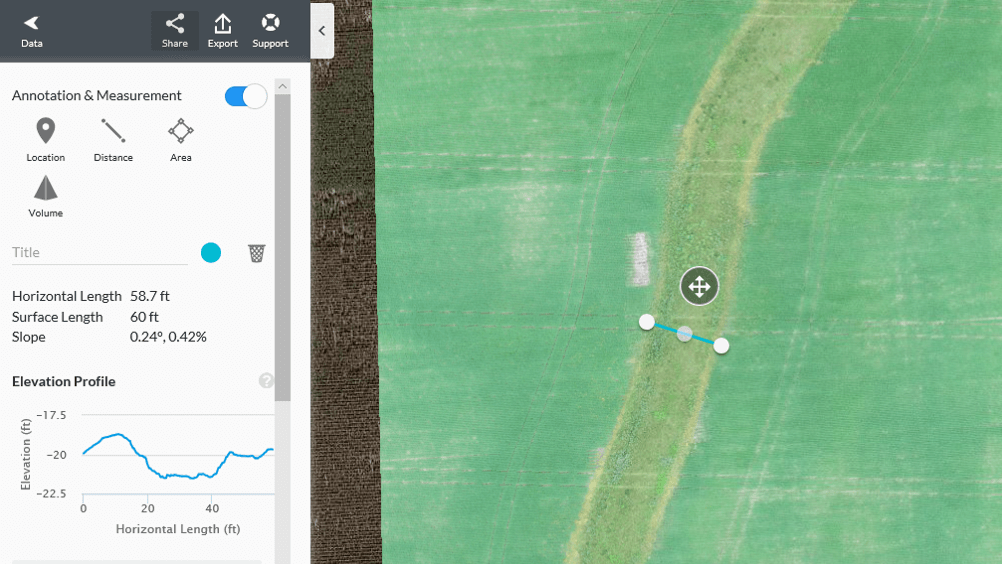
Stitching software can measure the depth of a grassed waterway to determine both water capacity and compliance within a Conservation Reserve Program (CRP). The graph on the left shows a shift in the elevation profile. The spike in elevation could have been caused by ground cover or inaccuracy of initial GPS points. We later determined weeds were the cause, which we validated from the ground. The use of a UAV for this type of management practice does not replace traditional boots-on-the-ground methods; however, it greatly reduces time and labor.
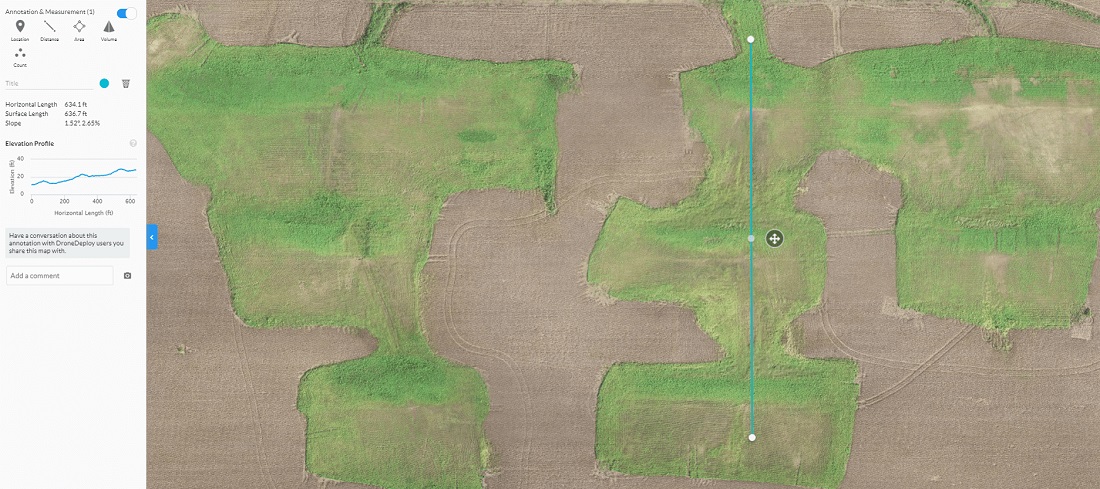
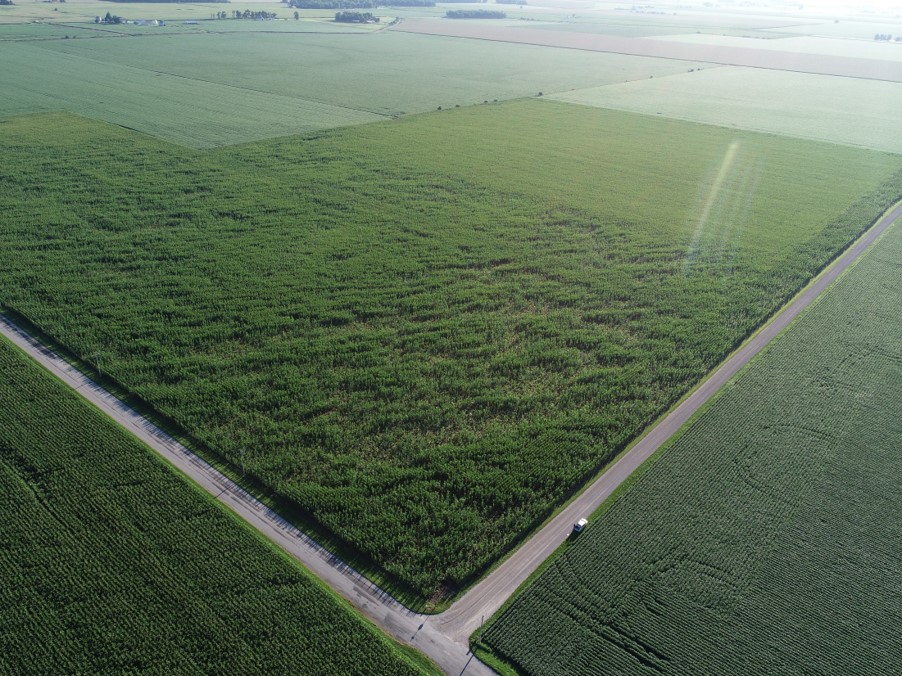
Here are views of three water and sediment control basin (WASCOB) structures, each containing two to three basins. A WASCOB is designed to control water runoff after rain. Each structure has a subsurface drainage system at the lowest point of the basin where the water pools. Once the water reaches the top of the drainage system, it is discharged through the main tile system. Any sediment in the water settles to the bottom of the basin, which prevents permanent erosion and reduces pollution in other water bodies.
The elevation profile on the left of the image above makes it possible to see overall hillslope as well as each individual berm.
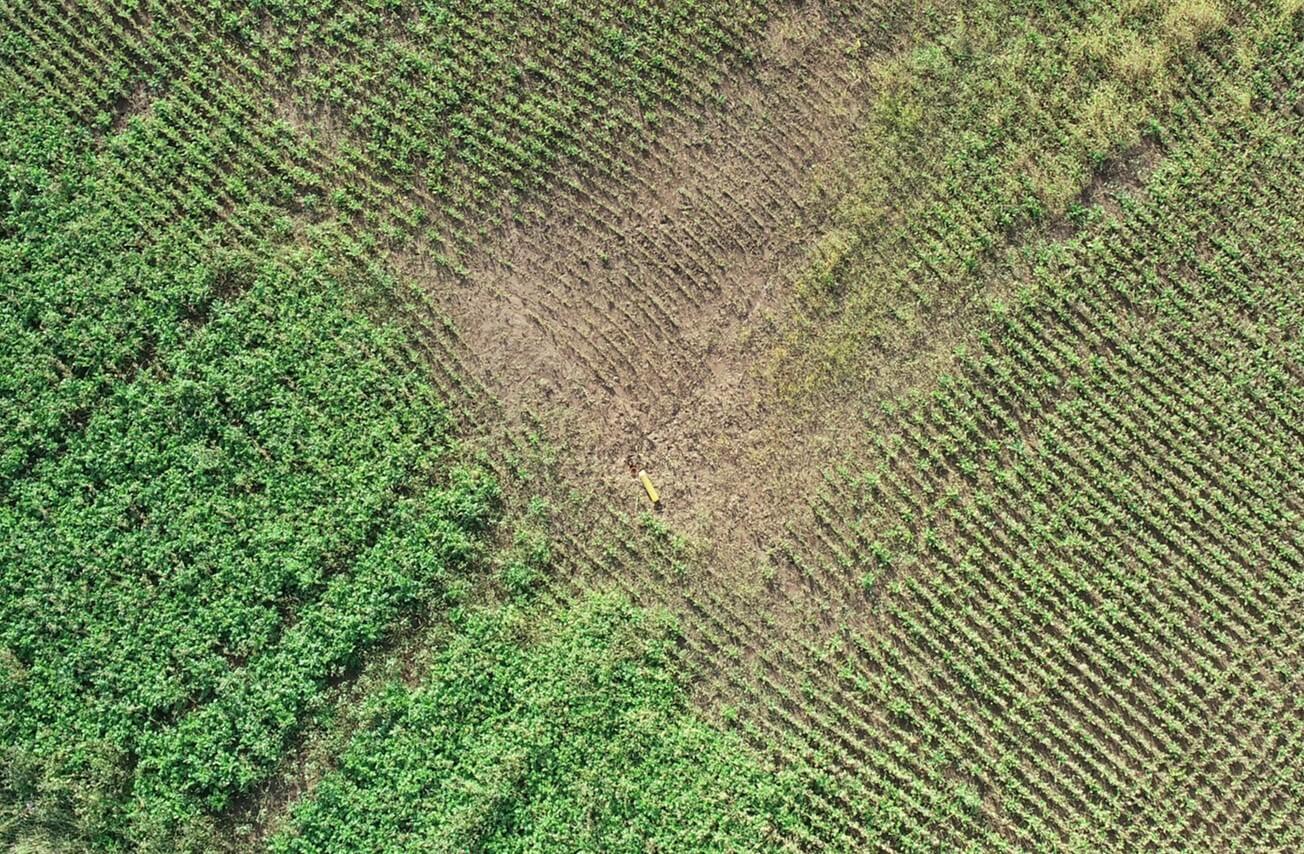 The image below shows a subsurface drainage structure knocked over, most likely due to flooding. It was not functioning and needed repair.
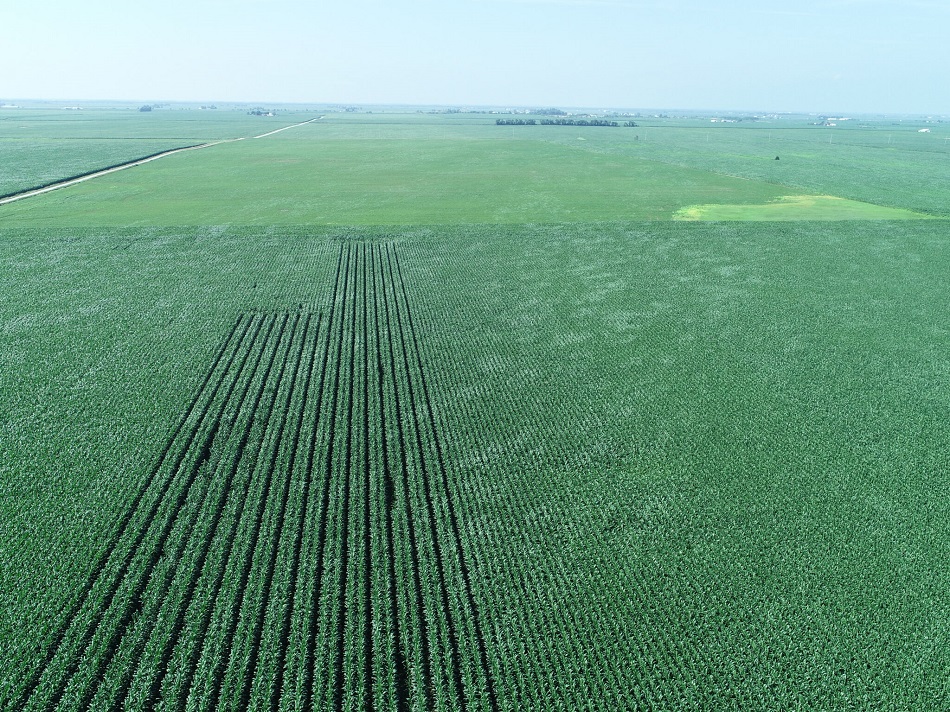
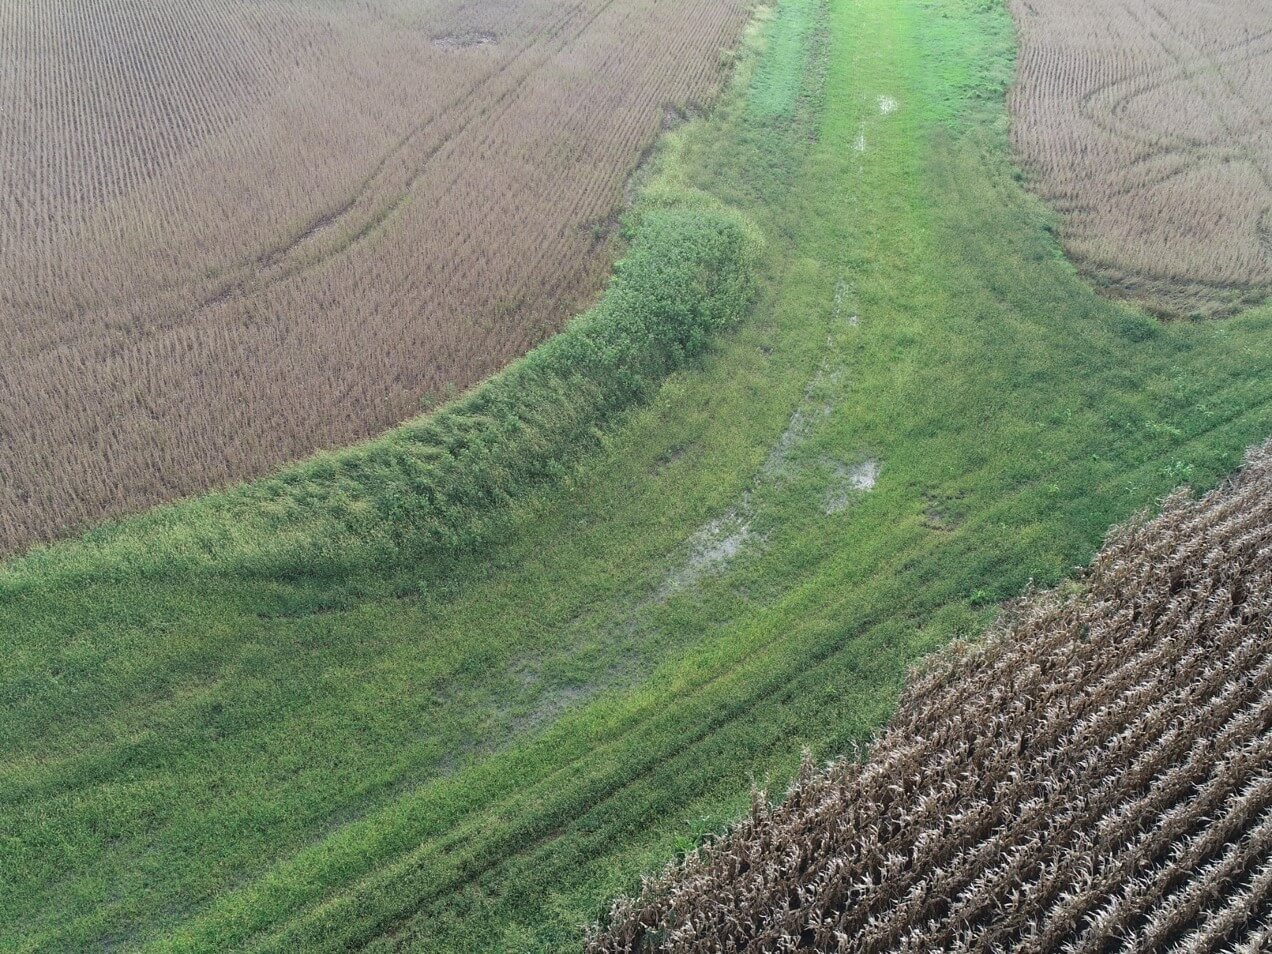 Water standing in this newly installed grassed waterway (above) indicates a problem. While several issues could be at fault, an exact determination requires someone to closely examine the tile However, the UAV is a good tool to offer a snapshot of performance to conservationists.
 In-field Conservation Examples
In 2019, this producer took preventative planting due to wet spring conditions...
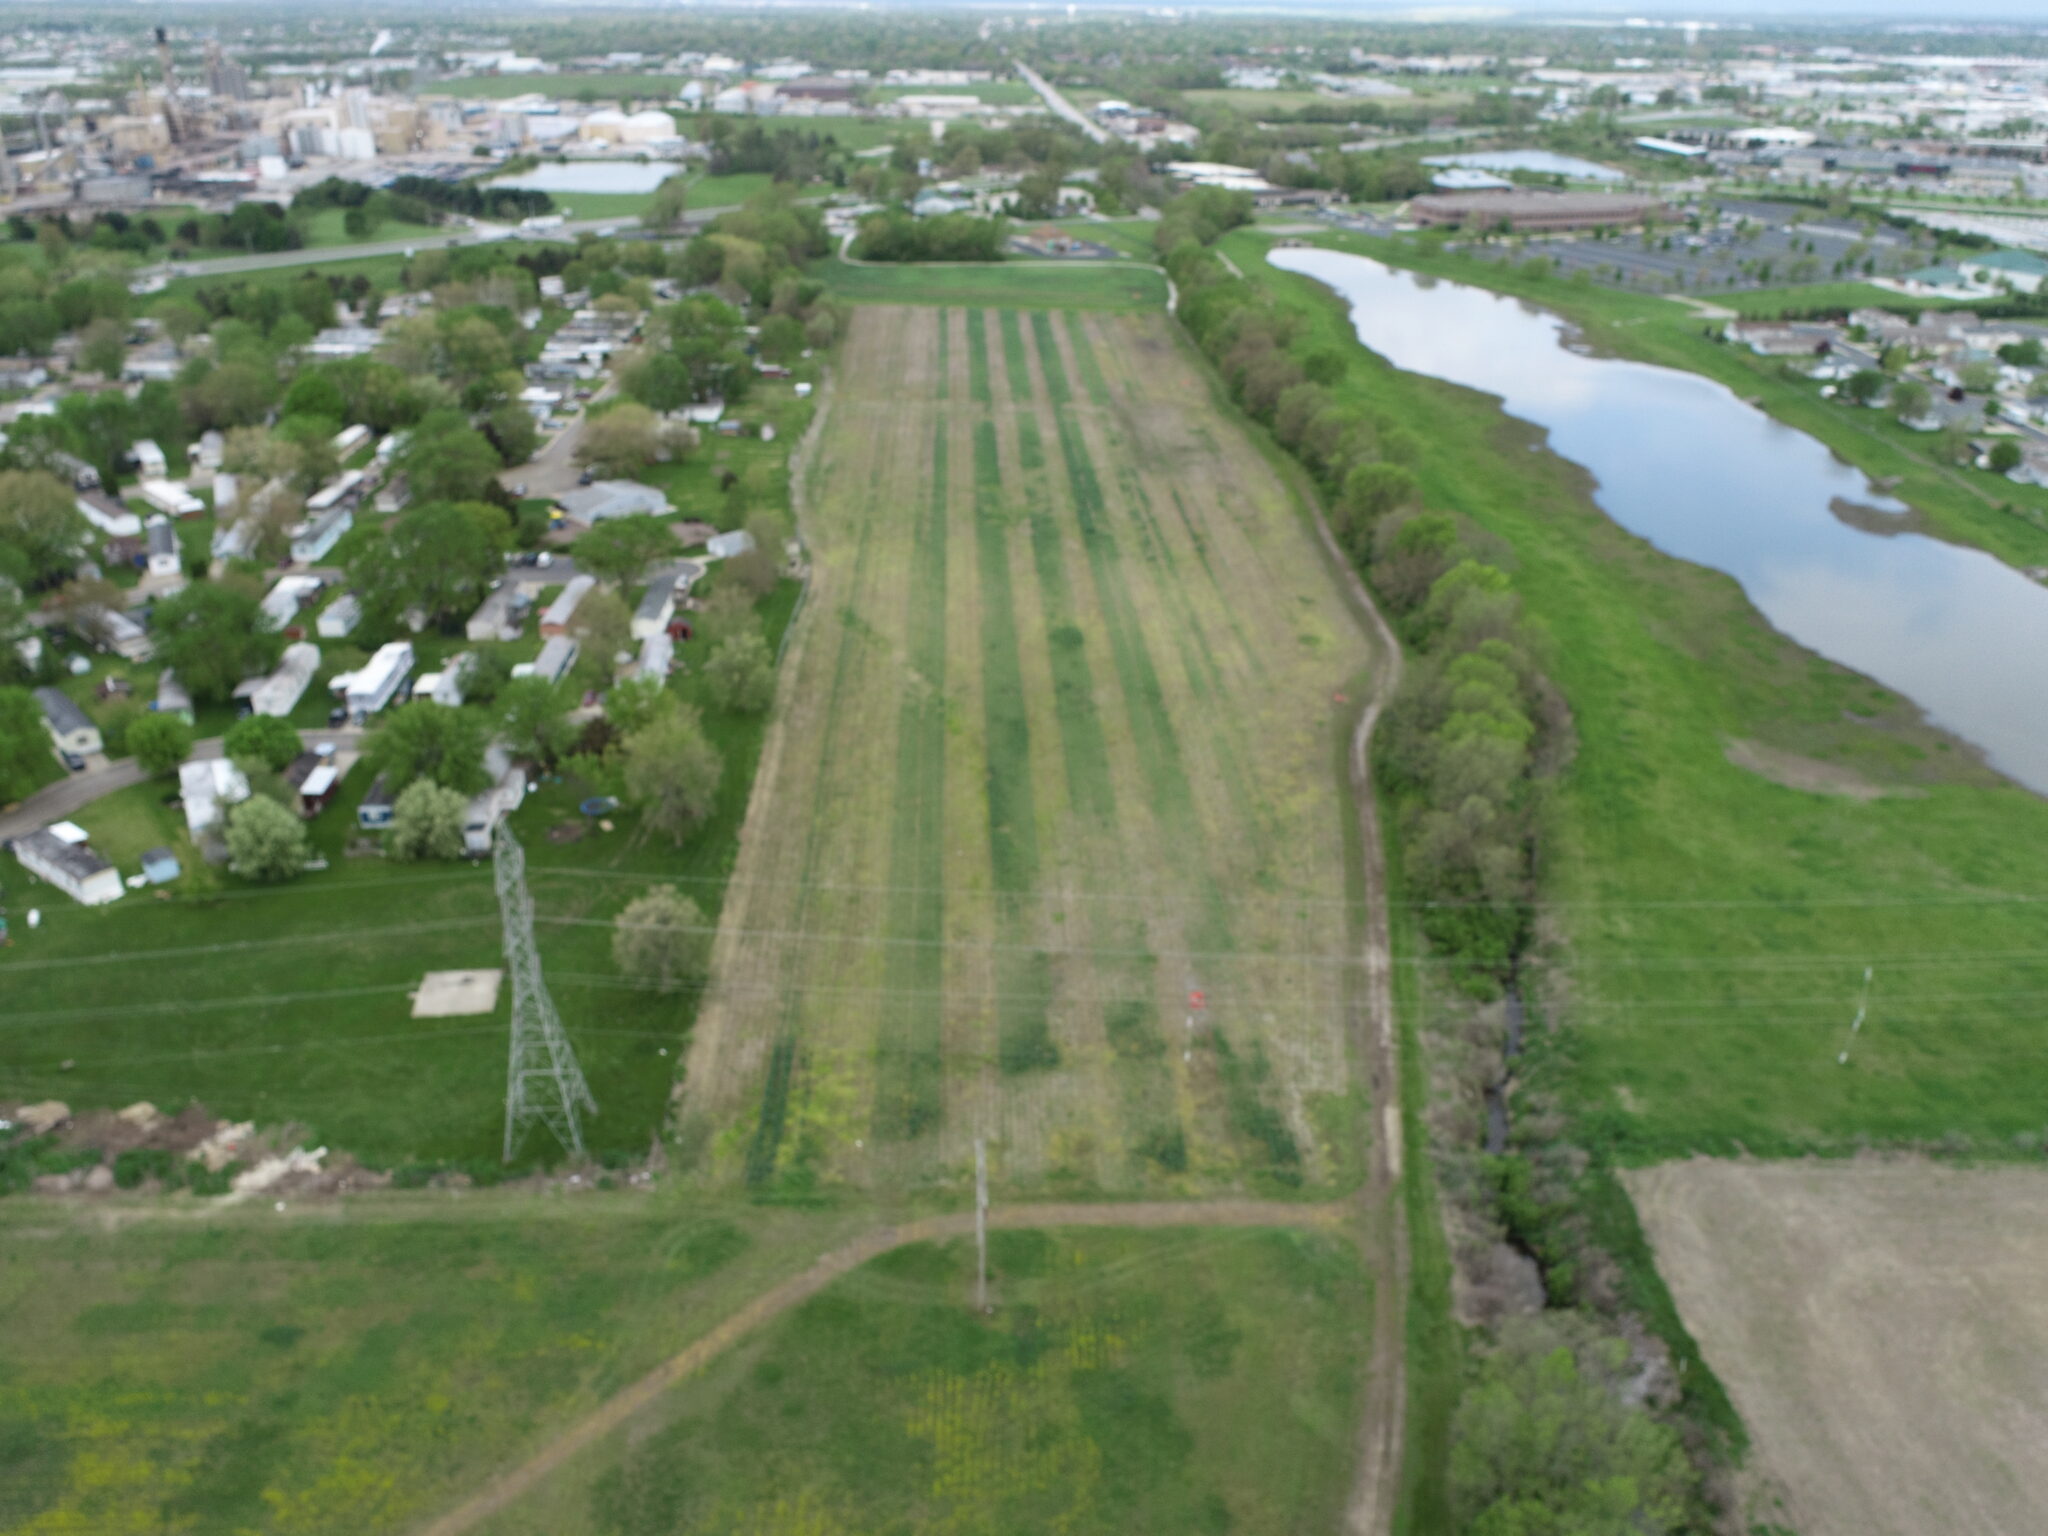
These flights evaluate conventional management with no-till cover crop management...
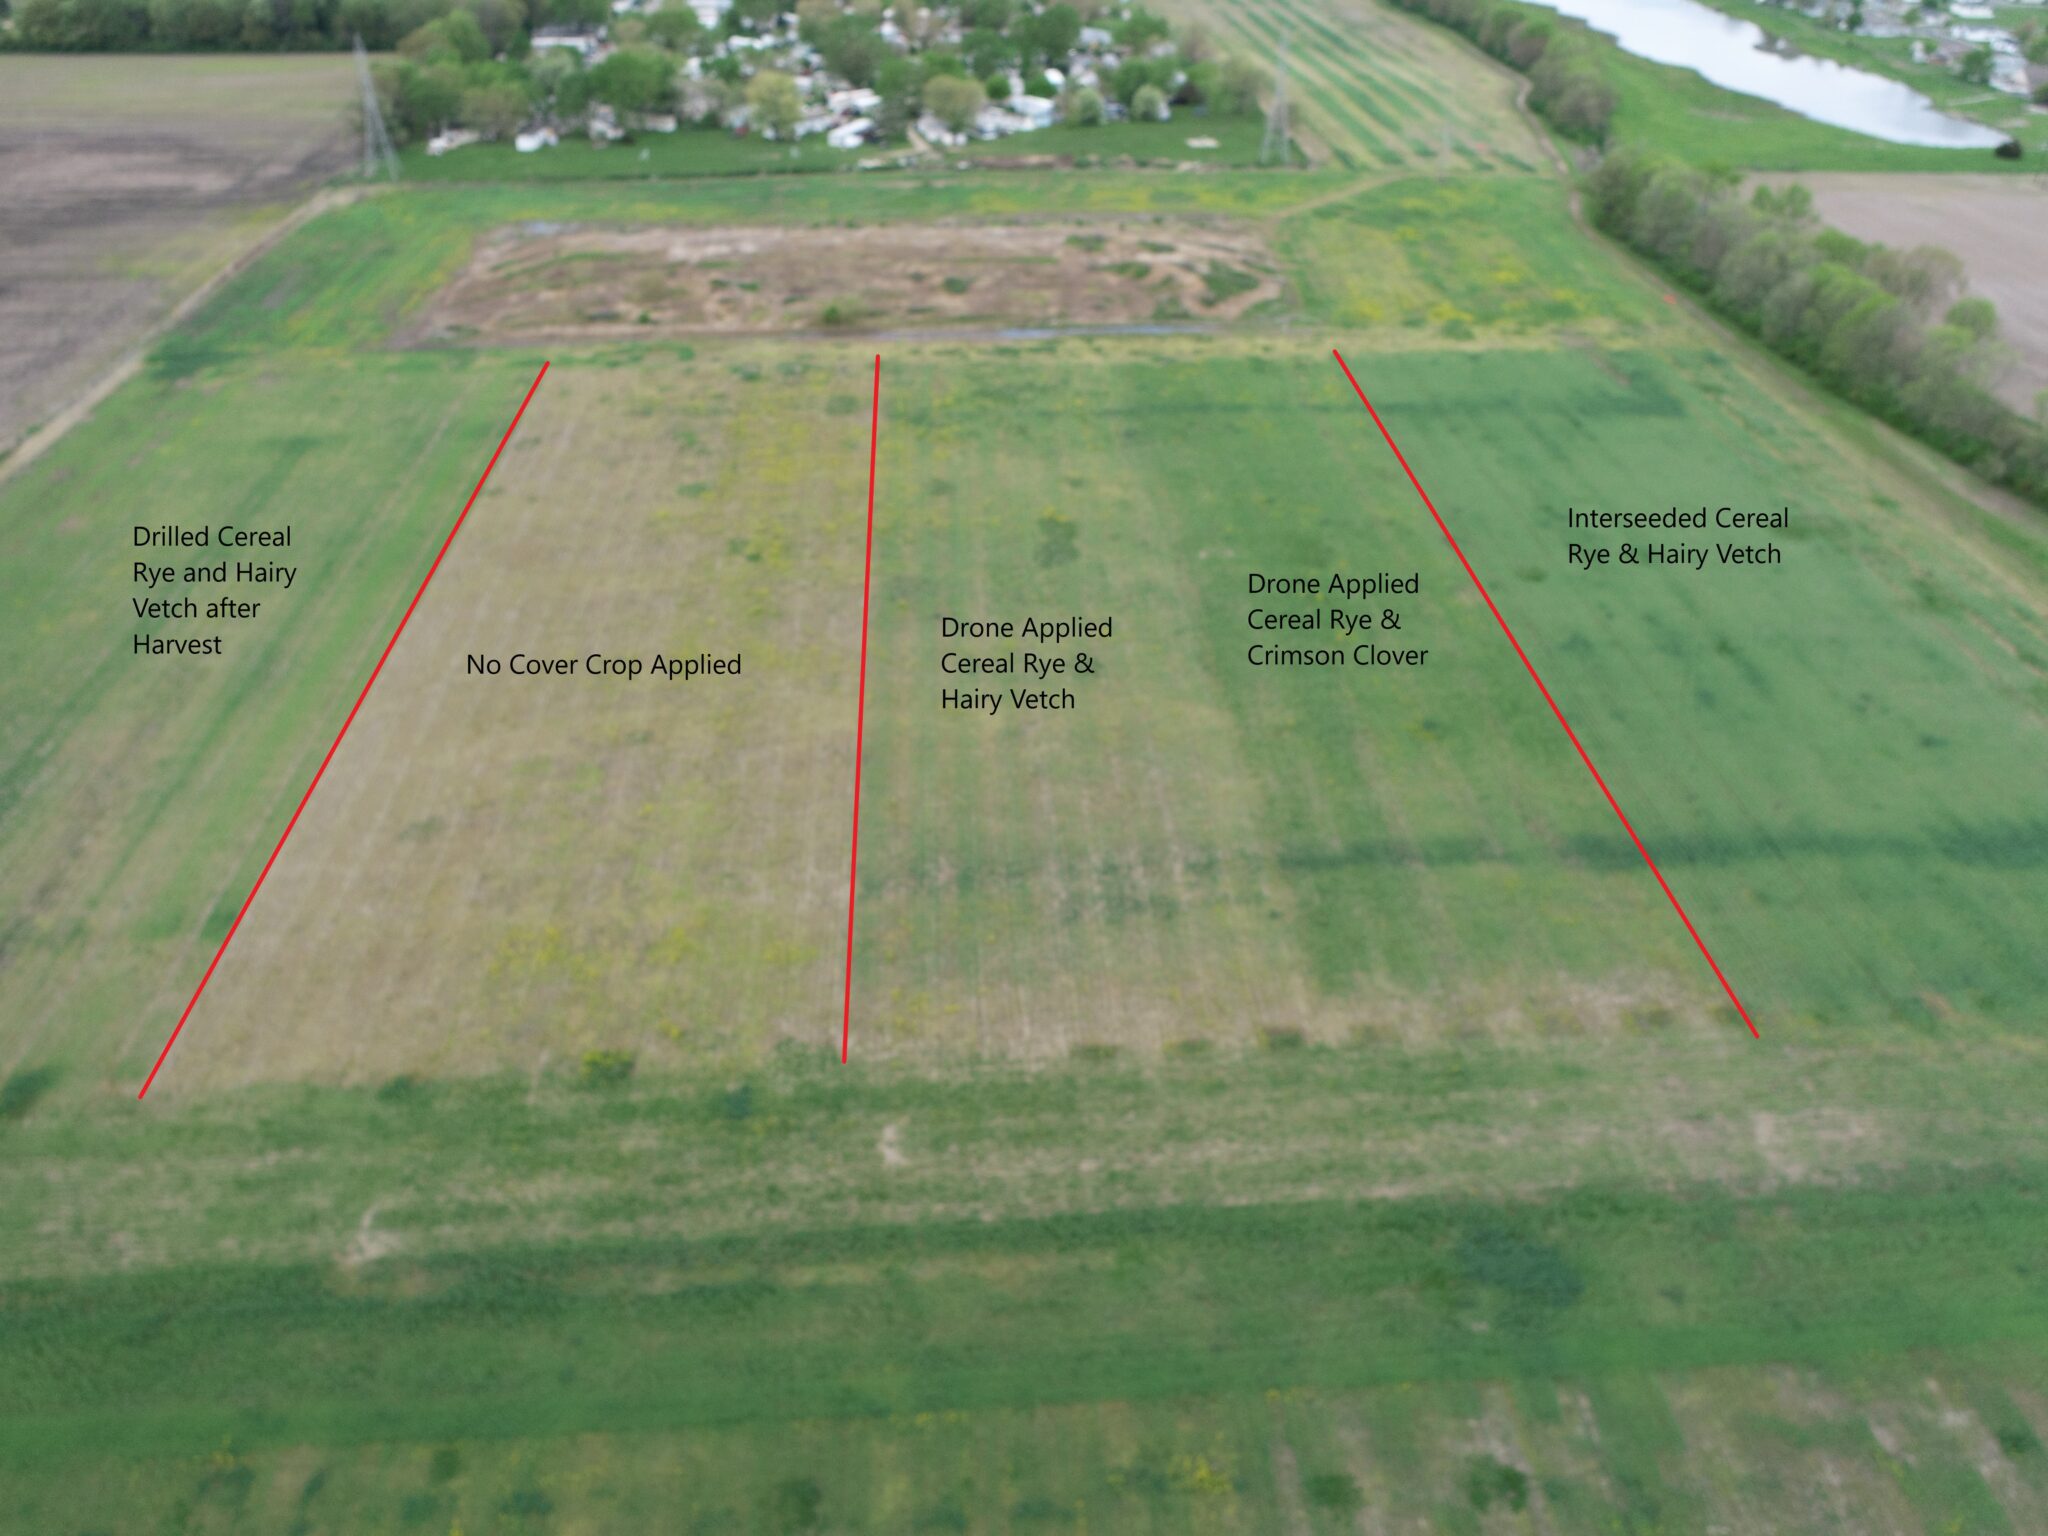
Different cover crop application methods and timing of those applications were evaluated at Ivy...
In addition to the cover crop comparison above, some strips of cereal rye/hairy vetch were...
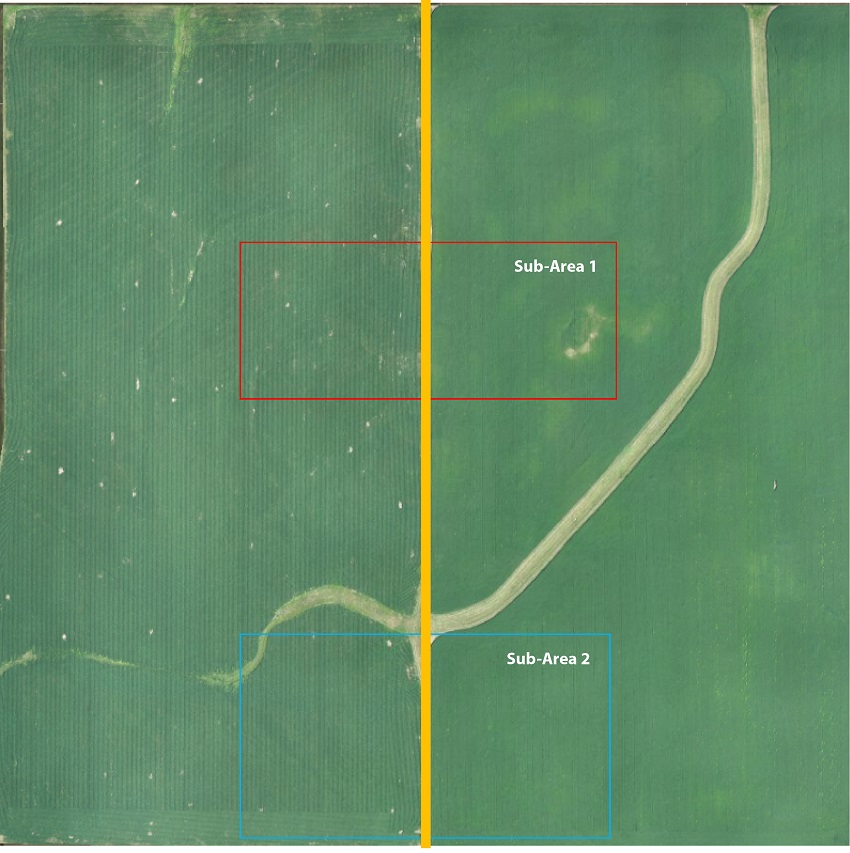
The map below was created a few days after spring termination of the cover crop. Treatments...
A local producer wanted to interseed cover crops at planting time to maximize benefits and was...
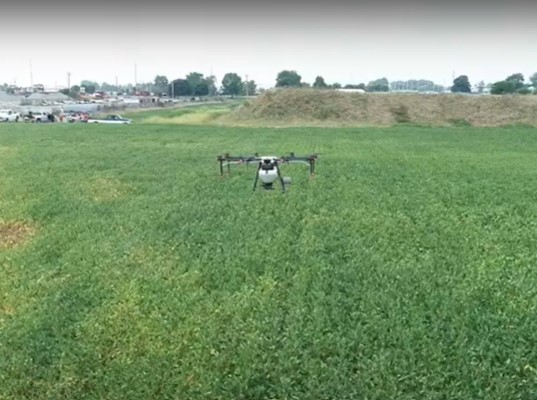
A DJI Agras was used to spread cover crops over standing soybeans. Cover crop mixes varied and...
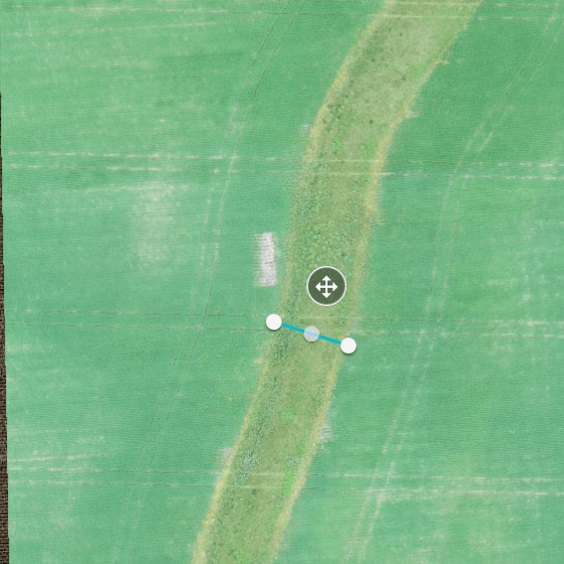
Stitching software can measure the depth of a grassed waterway to determine both water capacity...