USDA Releases Updated Plant Hardiness Zone Map
The United States Department of Agriculture (USDA) recently released its updated Plant Hardiness Zone Map.
The USDA Plant Hardiness Zone Map uses weather data to map average annual extreme minimum temperatures (winter lows) over a recent 20-year period. The most recent release covers weather data from 1991-2020. The previous version, released in 2012, covered weather data from 1976-2005.
The map tells gardeners what plants are likely to survive winter temperatures in their area based on recent history. It also helps vendors of landscape plants to communicate to purchasers the range of zones for which particular plants are suited.
The USDA described the latest map as the most accurate and detailed it has ever released. It was jointly developed by Oregon State University’s PRISM Climate Group and the USDA’s Agricultural Research Service.
“The addition of many new stations and more sophisticated mapping techniques using the latest PRISM technology led to a more accurate and detailed Plant Hardiness Zone Map but also produced localized changes that are not climate related,” said Christopher Daly, director of the PRISM Climate Group and the map’s lead author.
The plant hardiness map contains 13 zones, representing 10-degree-F ranges. Each zone is further subdivided into two half zones, a and b, representing 5-degree ranges. Zone 1 starts in Alaska, and Zone 13 ends in Hawaii and Puerto Rico. Florida, famous for their palm trees, has zones from 8b to 11b. Palm trees won’t survive winters in Indiana.
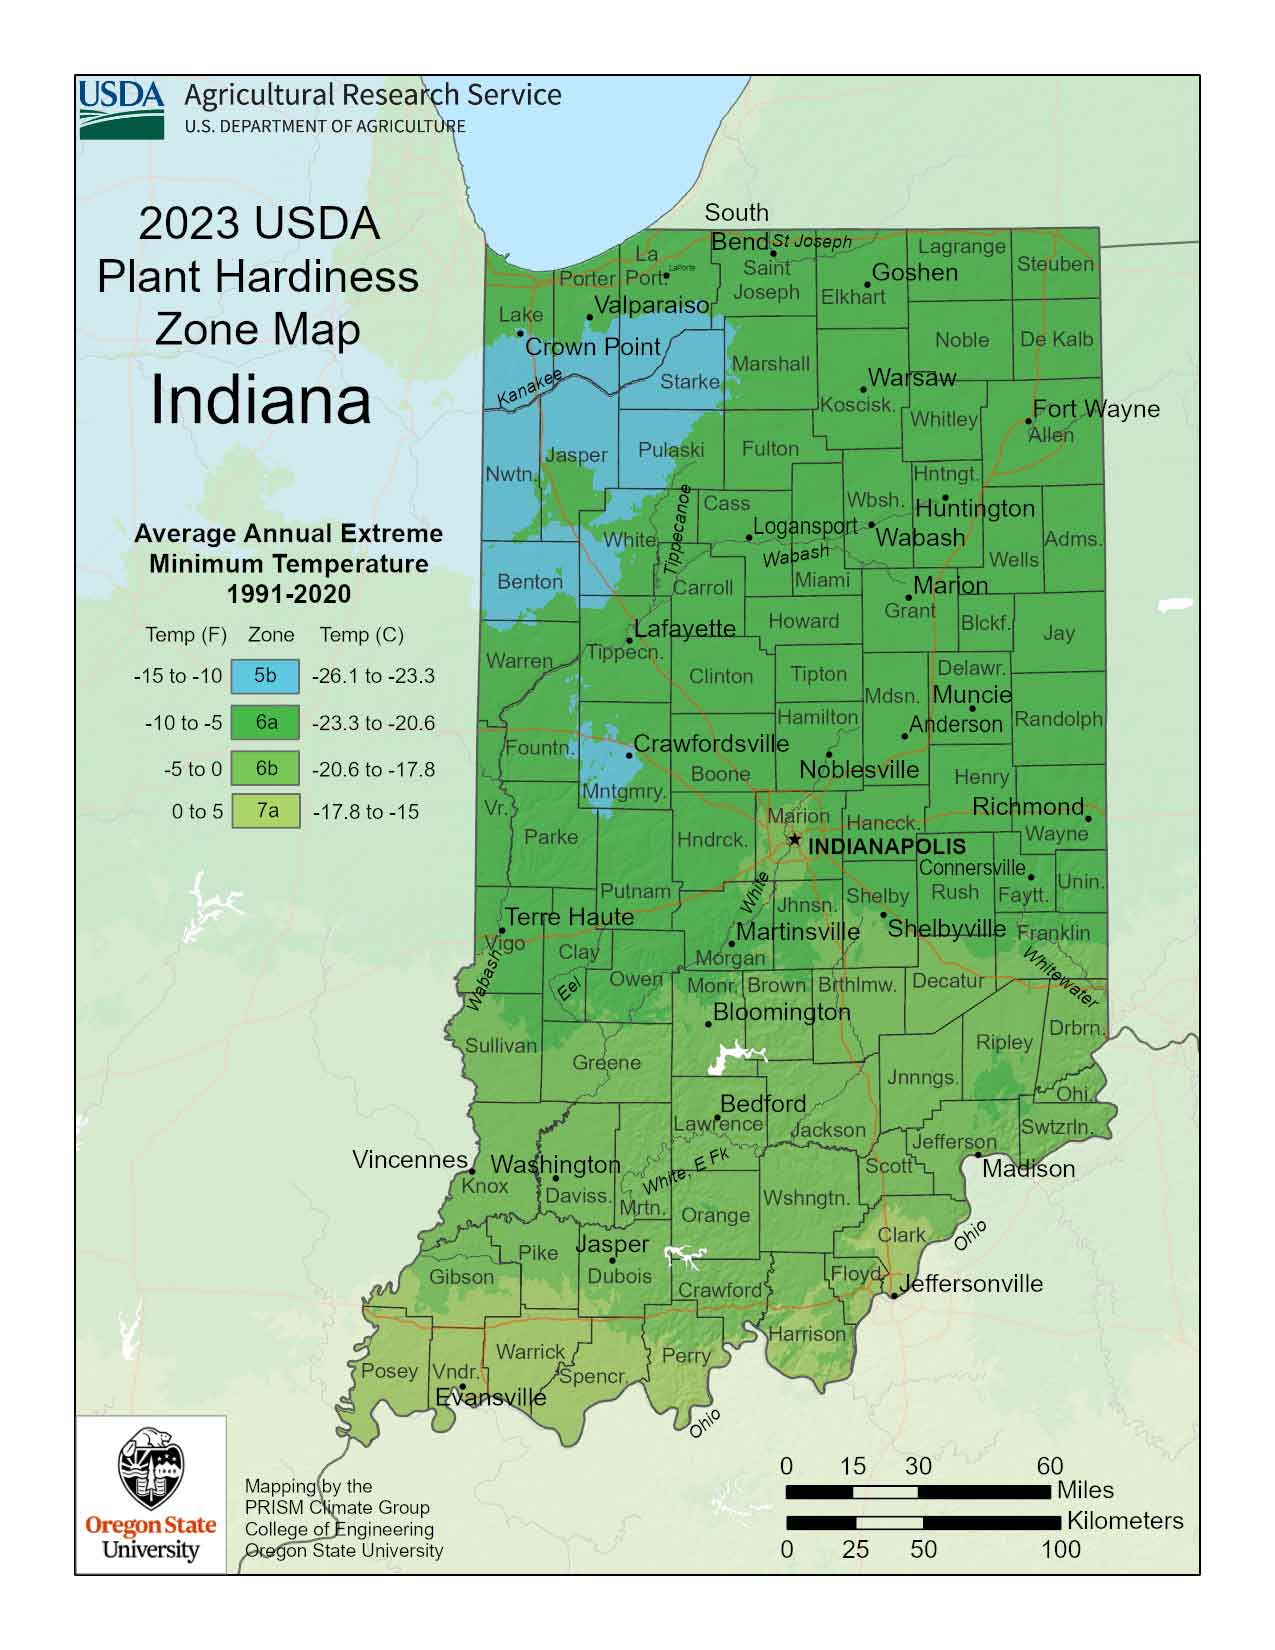
Indiana ranges from Zone 5b in the northwest, with average annual extreme minimum temperatures of -15 through -10 degrees F, through 7a, with average annual extreme minimum temperatures of 0 to 5 degrees F along the Ohio River. All of northeastern Indiana, including Whitley County, is in Zone 6a, with average annual extreme minimum temperatures of -10 to -5 degrees F. In the previous map, most of northern Indiana, including Whiley County, was predominantly in Zone 5b.
“Average” is the operative word on this map, based on recent 20-year temperature measurements. Winters with colder or warmer temperatures have and will continue to occur.
Find the USDA Hardiness Zone Map at https://planthardiness.ars.usda.gov/.
See below USDA Hardiness Zones for Indiana.