

Tracking 21st Century Diversity in Indiana Counties

As globalization continues to chug along and the digital age continues to take hold, communities in Indiana need to adapt in order to remain competitive. Remaining competitive however, is easier said than done. While adequate broadband infrastructure, an entrepreneurship ecosystem, a knowledge workforce, adequate housing, and access to capital remain key ingredients for this competitiveness, an often overlooked characteristic is worth looking at: racial and ethnic diversity.
Studies have shown that a diverse population leads to development and economic growth and while there are some negative effects, such as polarization and weak social cohesion, over time the positive outweighs the negative. For example, a study looked at the inflow of migrants over 50 years in multiple countries and found a positive impact on GDP. Another study, focusing on the US, looked at the settlement patterns of migrants during 1880, 1900 and 1910 and found that those counties with more diversity were significantly richer by 2010.
In addition, the “creative class” theory, which has been used as an economic development strategy by many communities argues that three “T’s” are required for any development to take place: talent, technology, and tolerance. This last “T” refers to a diverse and integrated community along racial and ethnic lines is a requirement to fully maximize the creative class’ potential.
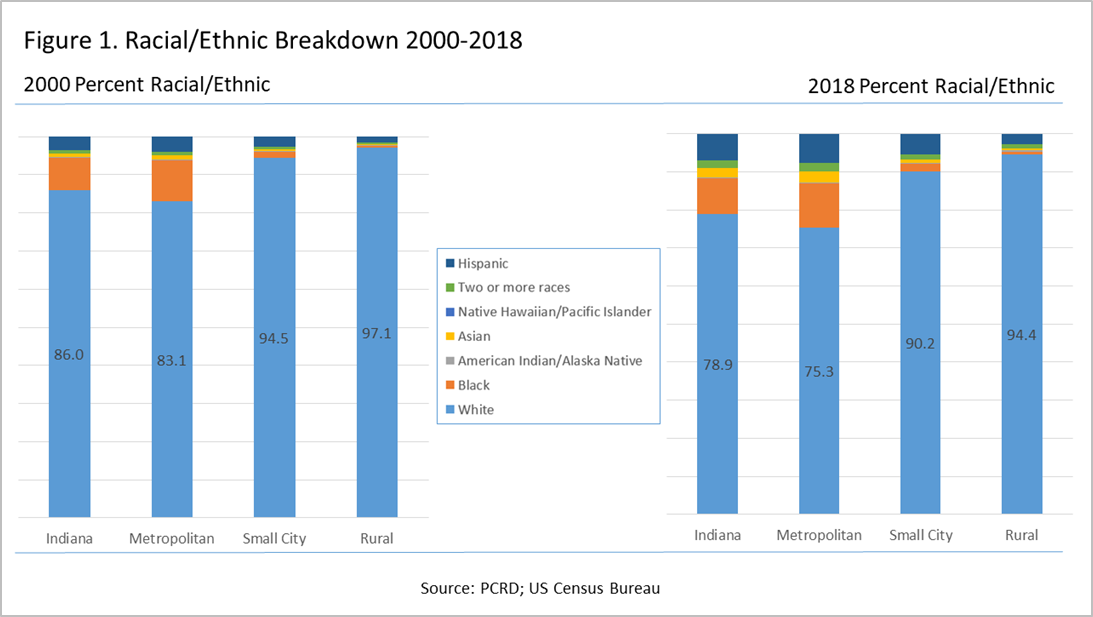
For these reasons, we took a look at the share of seven, mutually exclusive U.S. Census Bureau racial and ethnic categories (White non-Hispanic, Black non-Hispanic, American Indian and Alaska native non-Hispanic, Asian non-Hispanic, Native Hawaiian and other Pacific Islander’s non-Hispanic, two or more races non-Hispanic, and Hispanic) to see how racial and ethnic diversity has change in Indiana between 2000 and 2018.
Figure below shows the racial/ethnic breakdown using the seven categories discussed previously in Indiana as well as by county type (metropolitan, small city, and rural counties in the state) between 2000 and 2018. Notice how the majority of Indiana residents were White non-Hispanic (labeled WNH, light blue bar). However, the share of white non-Hispanic in the state decreased from 86 percent in 2000 to 78.9 percent in 2018. Still, much higher compared to the nation’s share of White non-Hispanic of 69 percent in 2000 and 60 percent in 2018 (not shown).
As expected, the minority (non-White) share of the population increased between 2000 and 2018 in the state as well as each of the three county types. The share of Black non-Hispanic increased from 8.4 percent in 2000 to 9.5 percent in 2018. Asian non-Hispanic increased their share of the Indiana population from one percent in 2000 to 2.4 percent in 2018. In rural counties, for example, the share of Hispanics, while still less than three percent, doubled from 1.4 in 2000 to 2.8 in 2018.
In order to better quantify how diverse Indiana counties are becoming, a diversity score was calculated. This diversity score, also known as an ethnic fractionalization index, ranges from 0 to 100, where a score of 0 shows no diversity at all (one single racial/ethnic category represents the entire population) while a score of 100 highlights a maximum diversity possible. Figure below shows the diversity scores for the U.S., Indiana, and each of the county types in the state.
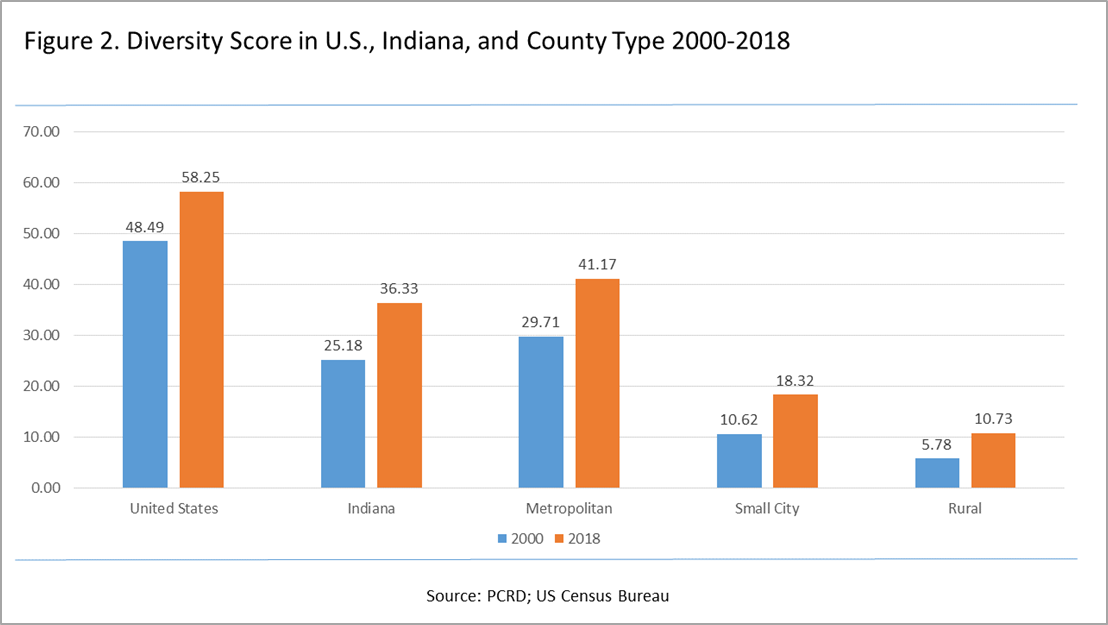
All scores have increased between 2000 and 2018. And while Indiana’s score is about two-thirds of the U.S. score as of 2018 (36 versus 58), Indiana’s score did increase, more so than the nation’s, from 25 in 2000 to 36 in 2018. As expected, metropolitan counties in Indiana had a higher score compared to small city and rural counties. However, the diversity score of rural counties almost doubled from 5.7 in 2000 to 10.7 in 2018. In other words, while not mirroring state or national trends, small city and rural counties in Indiana did diversify between 2000 and 2018.
Curious to know which county is the most diverse in the state? Or which county experienced the highest increase in its diversity score between 2000 and 2018? Check out our interactive table below.
While there is still room to diversify even more, it is important to keep in mind that not all communities perceive racial and ethnic diversification in the same light. Education, awareness and cultural competency can help, though. Purdue Extension’s Navigating Differences program not only increases cultural competency but empowers community leaders and residents to work more effectively with others. As history has shown, more diverse and integrated communities are a must for economic opportunity to blossom.
 is a Purdue Extension community & regional economics specialist and Purdue Center for Regional Development assistant director. He has worked with rural communities over the past decade conducting local & regional community economic development, including use of technology for development. He can be reached at robertog@purdue.edu.
Featured Stories
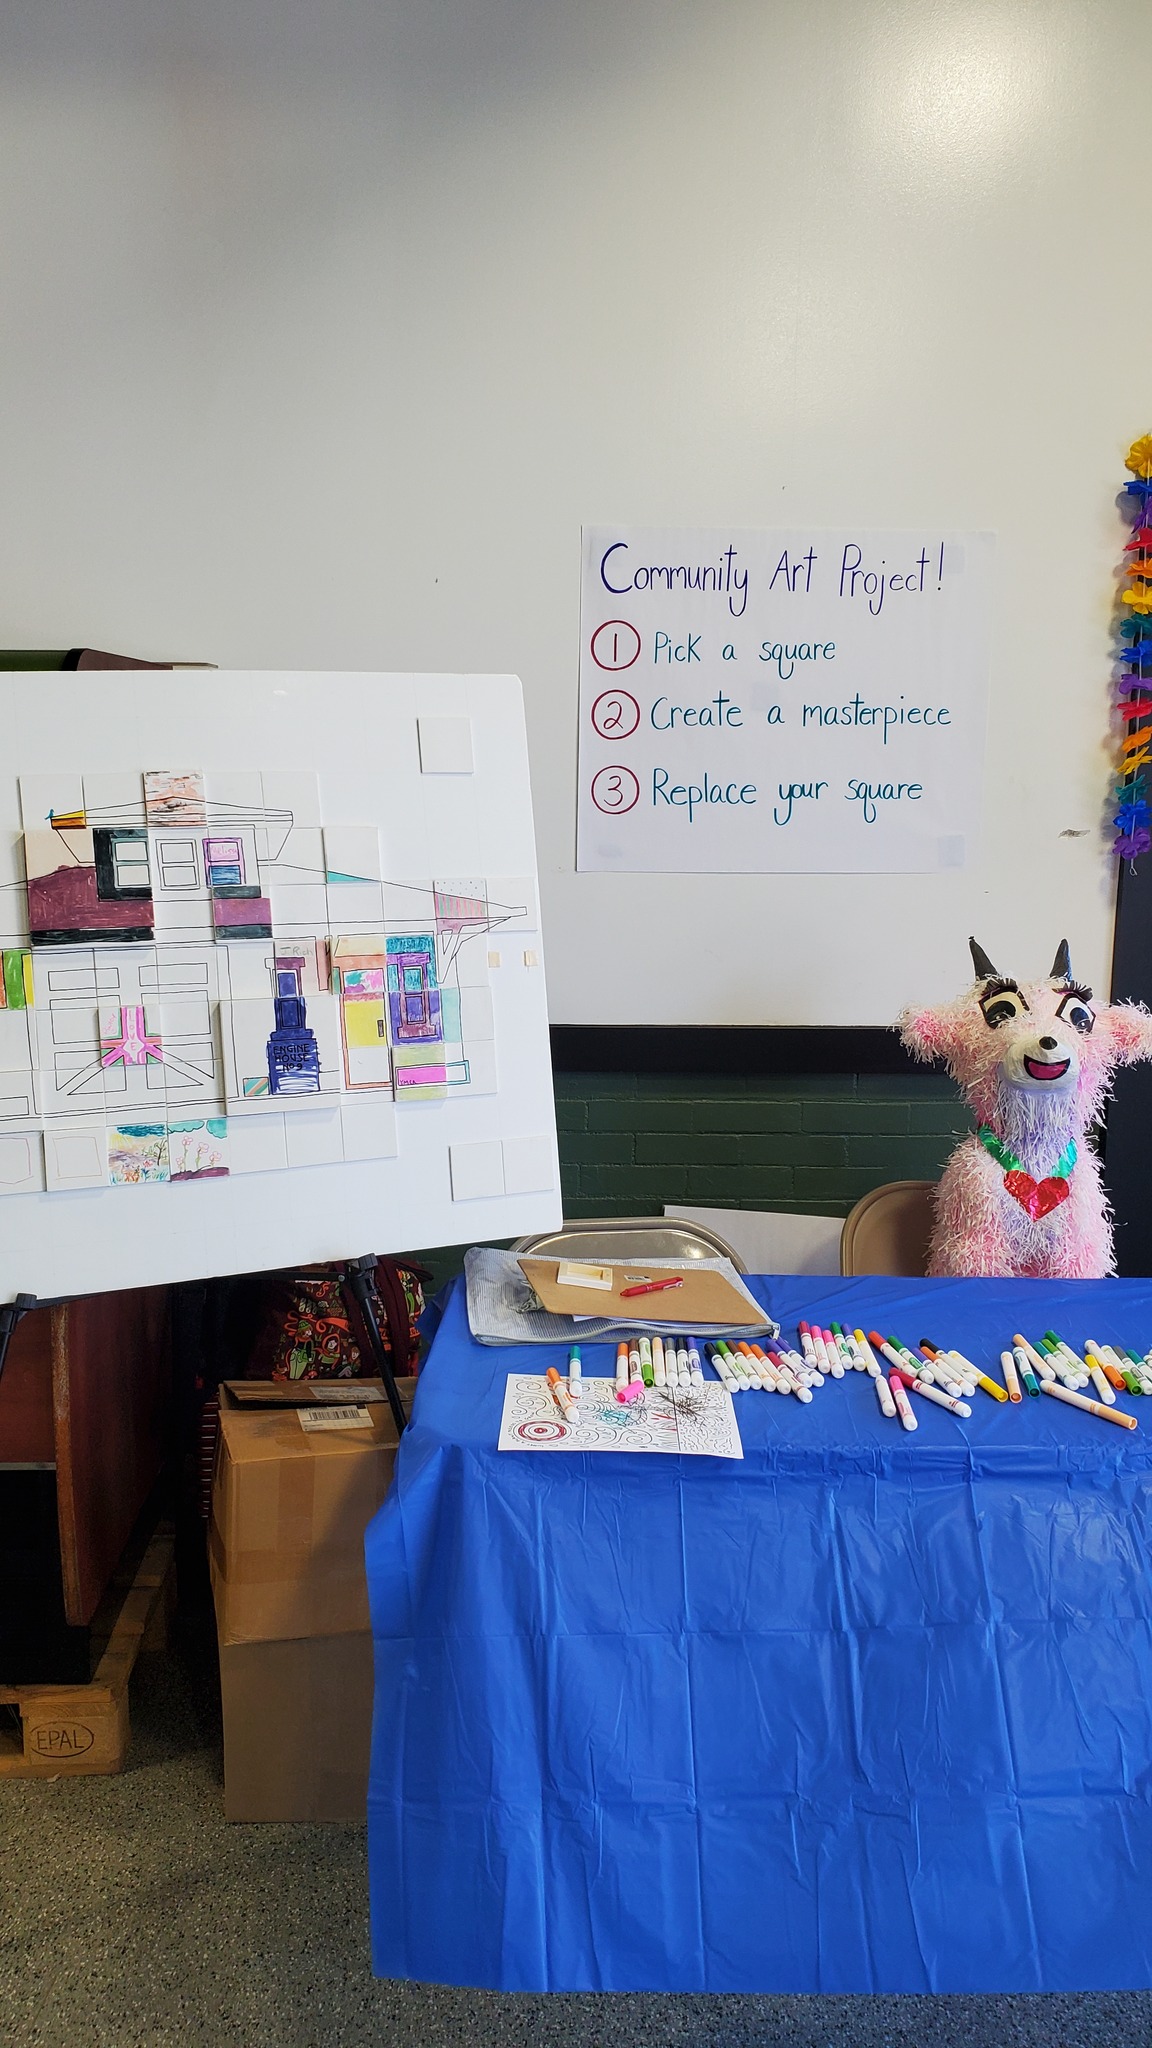
What does an old fire station, an urban farm, art, llamas, and a cookout have in common? They all...

I’ve been writing this column once a month for 25 years. Last month marked the 300th...
A Collaborative Partner for Small Town and Rural Planners

To accomplish our mission, we must effectively collaborate with our partners at all levels to...
The Indiana General Assembly passed a bill to reform property taxes back in April. It’s the...
The Indiana Constitution of 1851 had a very broad idea of what should be taxed by the property...