Turf
UAV Benefits
- Improve turf and landscaping management practices
- Detect emerging patterns that might otherwise go unnoticed
- Improve lawn quality by targeting site-specific issues
- Manage sporting fields with reduced economic and environmental costs
- Evaluate different mowing techniques for desired appearance and performance
- Identify and quantify unwanted plants for removal as an alternative to applying chemicals
UAV Challenges
Timing: Timing flight before or after an event or management practice is critical to the outcome of the data.
- Tip: Know what information is needed and work with groundskeeping personnel to plan the flight based on mowing and event schedules.
Clouds: Shadows will ruin turf images and maps. A plant health map is a very valuable tool, but images with clouds are not.
- Tip: Fly when skies are fully overcast or clear for optimal image quality.
Crowds and people: Operating a UAV over a crowd of people without a wavier is a violation of Federal Aviation Administration (FAA) regulations. This can be difficult in recreational settings.
- Tip: Use special caution and be proactive by having a waiver in place if people will be present.
Examples
Heat stress in home lawn
Images collected by Nikky Witkowski, Agriculture & Natural Resources Educator, Purdue Extension – Porter County
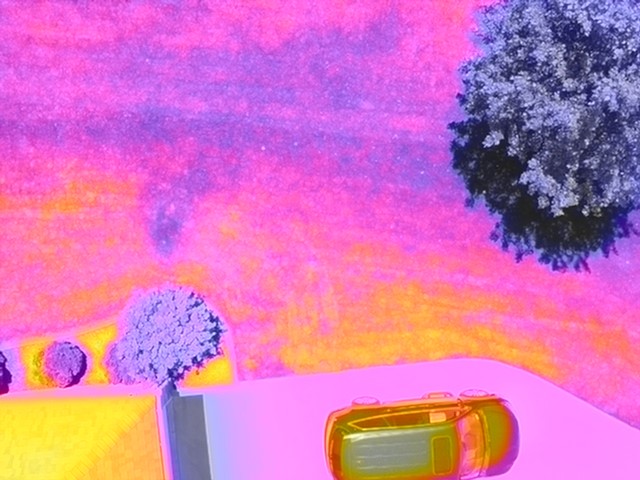
A thermal camera was used over a residential yard to identify problematic areas due to heat stress. The true color, or RGB, image shows the area as it appears from the air. In the thermal image on the right, the yellow shows hot, stressed areas and the purple shows cooler areas. The stressed grass near the driveway could be catching reflected heat from the driveway, which could also be a result of low moisture and poor soil conditions from driveway construction. The grass areas further away from the home are shown to be less stressed and cooler.


Football field management
Images collected by Bryan Overstreet, Agriculture & Natural Resources Educator, Purdue Extension – Jasper County
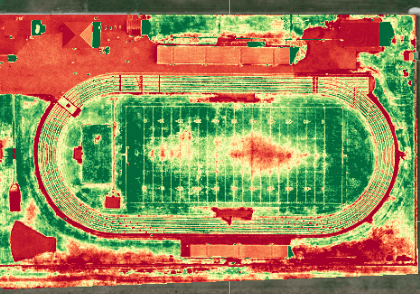
About halfway through the football season, images were taken to identify major wear and tear on the field. The top edge of the image is where the home bench is and the bottom edge is for visiting teams. There were a couple of rainy Friday-night games in between the capture of these two images and damage is clear due to activity. This data helped the grounds crew to take corrective action on specific areas.
September 2018


October 2018


This project expanded in 2019 to also include Clinton Prairie High School and Ross-Ade Stadium. Groundskeepers and turf managers were not only interested in areas of wear and tear but also maintenance strategies to address these issues and more.
Rensselaer High School
Images collected by Bryan Overstreet, Agriculture & Natural Resources Educator, Purdue Extension – Jasper County
You can see wear on the field throughout the football season, but the brown edges on the outskirts of the field in September represent drought. Identifying the problem early helped groundskeepers adjust the problem with irrigation.
9-17-19


10-17-19


10-23-19


Clinton Prairie High School
Images collected by Adam Shanks, Agriculture & Natural Resources Educator, Purdue Extension – Clinton County
There is much more wear along the center of the field later in the season.
8-30-19

8-30-19

Ross-Ade Stadium
Flown by John Scott, Digital Agriculture Extension Coordinator, Purdue Extension
Purdue Athletics teamed up with Purdue Extension to fly Ross-Ade Stadium weekly from August 9 through the end of the 2019 football season. The images below correspond with the week before and after each home game. Because of environmental conditions and time constraints, not all imagery was collected the same day or time of each week. However, all flight patterns are identical.
9-3-19
A pre-season map after two scrimmages and four days before the first home game.


9-9-19
The week after first home game. Some wear is evident, especially toward the end zone.


9-16-19
The week after the second home game and wear is evident across the field.


10-2-19
The week after the third home game with wear patterns forming across the field. The quality of the map is poor due to shadowing.


10-8-19
The week before the fourth home game showing improved turf health as a result of field preparation.


Soccer field at Rossville High School
Images collected by John Scott, Digital Agriculture Extension Coordinator, Purdue Extension
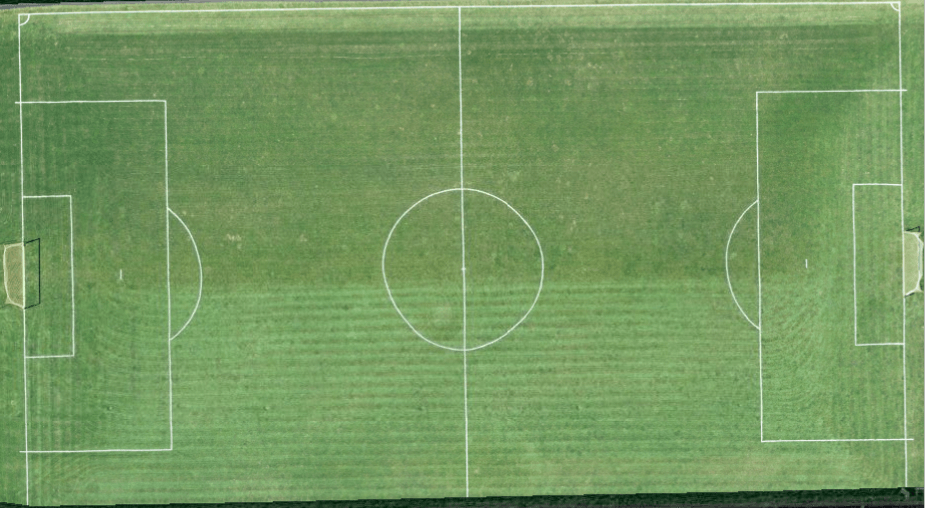
A stitched orthomosaic image (left) and a plant health image (right) show machine- and human-wear patterns on the field. Wear patterns identify areas in need of management. After the first flight, it appeared the top half of the field was heavily worn, an atypical finding that could have resulted from a camera error. The field was flown multiple times with several settings, and the same patterns emerged each time. We presented this to a group of students on the soccer team, and given their practice tendencies, corroborated this trend.


Post-season baseball field
Images collected by John Scott, Digital Agriculture Extension Coordinator, Purdue Extension
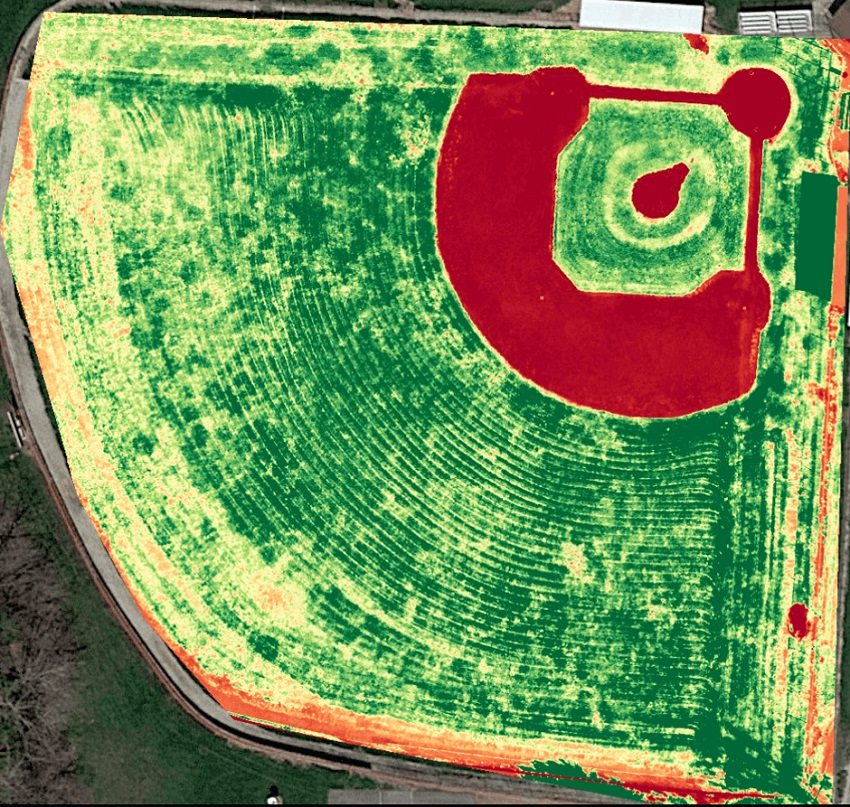
This stitched orthomosaic image and plant health image was taken in September after baseball season as a way to see how the turf had been managed. The lines indicated a recent mowing, and we notice a few rough areas in the outfield. Further validation or ground-truthing needs to occur to identify the exact problem before any corrective action can be recommended.


Golf course
Images collected by Bryan Overstreet, Agriculture & Natural Resources Educator, Purdue Extension - Jasper County
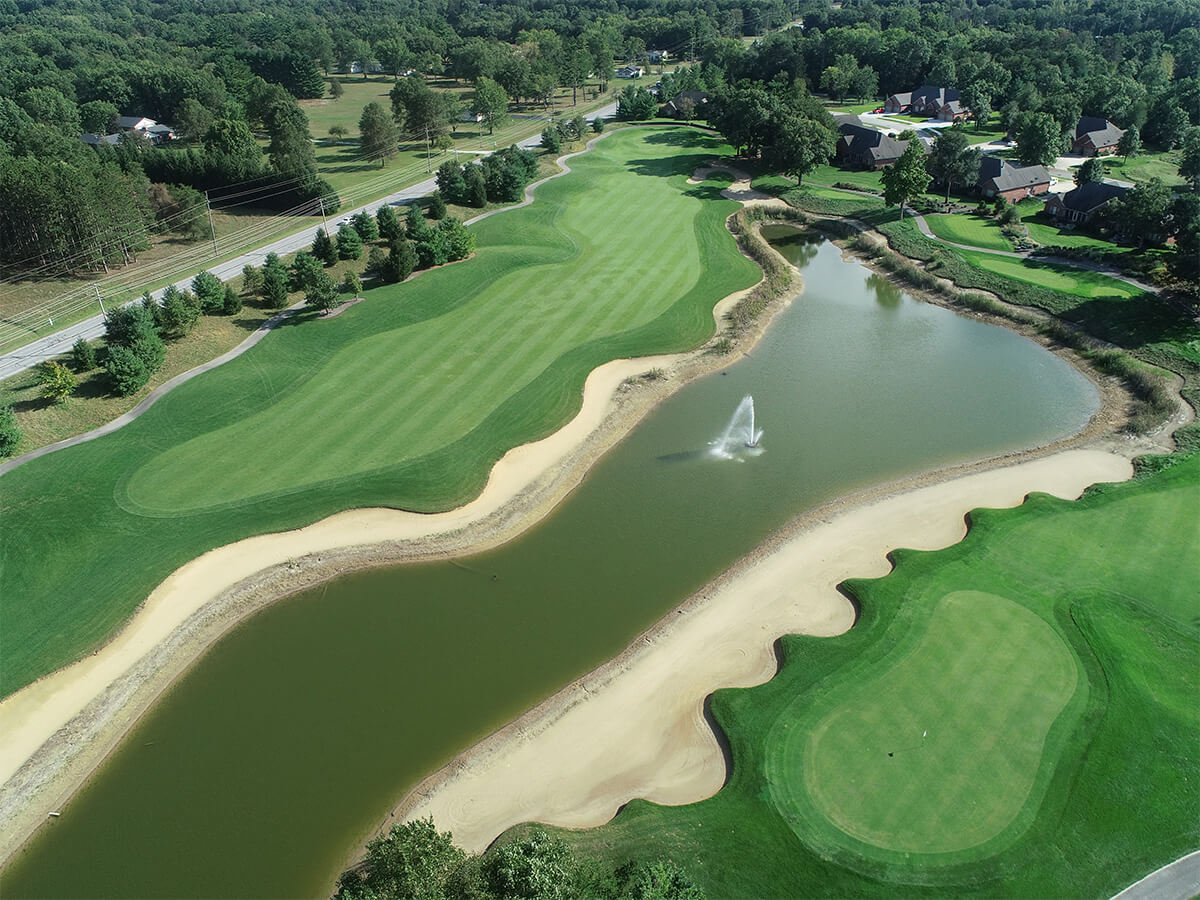
Golf courses are among the intensely managed turf systems. Different courses – and even different sections of the same course – will use different mowing and fertility strategies. A course's mixture of trees, grass, sand and water will make image interpretation difficult. Golfers also regularly occupy the course, which is a safety concern. The image below doubles as an observation of turf management practices and a great marketing asset. Groundskeeping can quickly view the entire course and adjust plans as needed. In turn this improves inventory, reduces costs, refines maintenance plans and enhances customer satisfaction.

Flown Mark Carter, Agriculture & Natural Resources Educator, Purdue Extension – Delaware County
In 2019, flights were conducted on Walnut Creek Golf Course in Marion, IN. Many improvement opportunities were identified for overall turf health, such as:
- Fertilizer treatments
- Tree root competition
- Shade
- Irrigation and drainage
- Compaction and traffic
This knowledge was shared with golf course maintenance to make effective and efficient use of limited resources in improving ground conditions.


The map series was generated using the Quantix fixed-wing UAV from AeroVironment. It excels in covering large tracts of land quickly and delivers actionable maps for near real-time decision making.

Residential yard
Images collected by John Scott, Digital Agriculture Extension Coordinator, Purdue Extension
This stitched map was taken to observe turf and tree health. It was possible to see turf around trees that are struggling. This could have been due to competition for sunlight or water. It is also possible to locate the septic finger system, tile lines and “fairy rings.” The first image shows the lawn prior to mowing and the second image after mowing. Light intensity of each photo is also different, probably due to the time of day for flight. We could still identify the septic and tile lines in the second image; however, mowing eliminated some of the fine details.

