ID-155
The amount of time available to complete various field operations is extremely important in the selection and sizing of farm machinery. The number of days in which fieldwork can be performed during critical time periods must be known in order to determine the minimum daily field capacity required tor a machinery system. A system with greater-than-minimum capacity provides greater-than-minimum assurance that a particular field operation will be completed when desired. One with less than the minimum daily capacity cannot be relied upon to get the job done on time.
This publication is the first of a series dealing with the various management considerations involved in sizing, selecting, operating and maintaining field machines and implements. Presented here is a method for determining equipment capacities needed to perform various field operations, based on a predicted number of suitable fieldwork-days within a desired time-frame. Once you know the acres-per-day minimum for a given field activity, you can then weigh the effects of other factors that influence needed machine capacity, such as hours of operation per day, field speed and field efficiency.
The first step in determining field capacities needed is to find out how many "good" days you can expect for getting a job done. This requires gathering data on likely work-days and adjusting them to your situation. Where to get and how to use such data are discussed here.
Specific Farm-Kept Records
The best source of information for determining the number of days suitable for fieldwork on your farm with your soils, cropping practices, etc. is your own records. A good set of records is built by keeping a daily log of not only which fields were worked and what operations were done, but also which fields could have been worked but were not and the reasons why.
Such information gathered over a few years coupled with rainfall records for various parts of your farm and notes on soil workability, wet spots, etc., will prove invaluable in field operation scheduling and machinery sizing decisions. The data will also help confirm the need for drainage work or modifications in your tillage system.
General Areawide Records
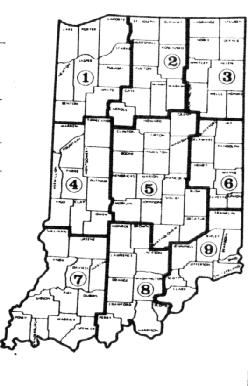
An alternative to specific farmer-kept fieldwork records is the more general "expected good work-days" information for large (multi-county) geographic areas. These data result from analysis of "work/no-work" information collected for Indiana's nine crop reporting districts since 1951 by the Indiana Crop and Livestock Reporting Service. By understanding how this work! no-work information was gathered and how the resulting data are to be interpreted. you can modify these district-wide figures to arrive at reasonable estimates of the number of good days for fieldwork on your farm within various time periods.
Table 1 summarizes the 28 years of work/no-work information analyzed for the state's nine crop reporting districts. The following paragraphs explain what the table includes, how to "read" it and with what degrees of confidence.
     TIME PERIOD              DISTRICT 1              DISTRICT 2              DISTRICT 3             DISTRICT 4
----------------------   -------------------     ------------------      ------------------     ------------------
Begin/End Dates  Length  50%  65%   70%   80%   50%   65%   75%   85%   50%   65%   75%   85%   50%   65%  75%   85%
-----------------------------------------------------------------------------------------------------------------------
                                 days                    days                   days                    days

SPRING ACTIVITY PERIODS (LAND PREPARATION, PLANT AND EARLY CARE CF CORN AND BEANS)

MAR 29 - APR 25  4 WKS  12.9  10.7   9.1   7.0  12.1   9.9   8.2   6.1  10.7   8.6   6.9   4.9  11.7   9.5   7.9   5.8
MAP 29 - MAY  9  6 WKS  2l.2  18.7  16.9  14.5  20.1  17.6  15.8  13.4  18.1  15.6  13.7  11.3  19.7  17.2  15.3  12.9
MAR 29 - MAY 23  8 WKS  30.1  27.1  24.9  22.0  29.0  26.1  23.9  21.1  26.6  23.7  21.5  18.8  28.0  25.0  22.7  19.9
MAR 29 - JUN  6 10 WKS  40.1  37.0  34.7  31.8  38.6  35.7  33.6  30.9  35.6  32.7  30.6  27.9   6.6  33.6  31.3  28.5
MAR 29 - JUN 20 12 WKS  49.2  46.0  43.5  40.5  47.8  44.9  42.7  40.0  45.4  42.4  40.1  37.3  45.7  42.4  39.9  36.8
APR 26 - MAY  9  2 WKS   8.1   7.4   6.8   6.0   7.9   7.0   6.4   5.5   7.2   6.3   5.7   4.9   7.8   6.9   6.1   5.2
APR 26 - MAY 23  4 WKS  17.0  15.6  14.5  13.1  16.6  15.2  14.0  12.6  15.6  14.2  13.1  11.7  16.1  14.4  13.1  11.5
APR 26 - JUN  6  6 WKS  26.6  25.2  24.1  22.7  25.9  24.3  23.1  21.6  24.4  22.9  21.7  20.2  24.4  22.6  21.2  19.5
APR 26 - JUN 20  8 WKS  35.8  34.0  32.7  30.9  35.1  33.3  32.0  30.3  34.2  32.4  31.1  29.4  33.6  31.5  29.9  27.9
MAY 10 - MAY 23  2 WKS   8.9   7.7   6.8   5.7   8.8   7.6   6.7   5.5   8.4   7.2   6.3   5.2   8.3   6.9   5.9   4.5
MAY 10 - JUN  6  4 WKS  18.8  17.4  16.4  15.1  18.3  16.8  15.8  14.4  17.4  15.9  14.8  13.4  16.8  15.0  13.6  11.9
MAY 10 - JUN 20  6 WKS  27.9  26.0  24.6  22.9  27.4  25.7  24.4  22.8  27.1  25.2  23.9  22.1  25.9  23.7  22.1  20.0
MAY 24 - JUN  6  2 WKS   9.8   8.9   8.2   7.3   9.5   8.4   7.7   6.7   9.0   7.9   7.1   6.1   8.5   7.3   6.4   5.2
MAY 24 - JUN 20  4 WKS  18.9  17.4  16.3  14.8  18.6  17.2  16.2  14.9  18.6  17.1  15.9  14.4  17.6  15.9  14.7  13.1
JUN  7 - JUN 20  2 WKS   9.1   7.9   7.1   6.0   9.2   8.1   7.3   6.3   9.7   8.5   7.6   6.5   9.1   8.0   7.1   6.0

SUMMER ACTIVITY PERIODS (LATE CARE OF CORN-BEANS, HARVEST WHEAT, DOUBLECROP BEANS, MAKE HAY)

JUL 21 - JUL  4  2 WKS   9.6   8.7   8.1   7.2   9.7   8.9   8.2   7.4   9.7   8.8   8.1   7.2   9.2   8.0   7.2   6.1
JUL  5 - JUL 18  2 WKS  10.0   9.1   8.5   7.7   9.8   9.0   8.4   7.7  10.2   9.4   8.8   8.0   9.2   8.2   7.3   6.3
JUL 19 - AUG  1  2 WKS   9.9   9.0   8.4   7.6  10.2   9.3   8.6   7.8  10.0   9.1   8.4   7.5   9.9   9.0   8.2   7.3
AUG  2 - AUG 15  2 WKS  10.9  10.3   9.8   9.2  11.0  10.2   9.6   8.8  13.7   9.9   9.3   8.5  10.3   9.5   8.8   8.0
AUG 16 - AUG 29  2 WKS  11.4  10.8  10.4   9.9  11.4  10.8  10.3   9.7  11.2  10.5   9.9   9.2  31.6  11.1  10.7  10.2
AUG 30 - SEP 12  2 WKS  11.8  11.3  10.9  10.3  11.5  10.9  10.4   9.7  11.5  10.9  10.4   9.8  12.1  11.7  11.4  11.0

FALL ACTIVITY PERIODS (HARVEST CORN SILAGE-BEANS-CORN GRAIN, PLANT WHEAT, LAND PREPARATION)

SEP 13 - SEP 26  2 WKS   9.9   8.8   8.0   6.9   9.9   8.0   8.0   6.9   9.7   8.6   7.7   6.6  10.0   9.0   8.3   7.4
SEP 13 - OCT 10  4 WKS  19.1  17.4  16.0  14.3  19.3  17.4  16.1  14.3  19.2  17.5  16.1  14.4  19.3  17.5  16.2  14.5
SEP 13 - OCT 31  7 WKS  33.9  31.5  29.7  27.5  34.5  31.8  29.7  27.2  33.9  31.3  29.3  26.8  34.1  31.8  30.1  27.9
SEP 13 - NOV 21 10 WKS  46.7  43.2  40.6  37.3  46.9  43.2  40.3  36.8  45.4  41.5  38.6  34.9  46.6  43.1  40.5  37.2
SEP 13 - DEC  5 12 WKS  53.7  49.3  46.0  41.9  48.9  48.9  45.4  41.1  51.9  47.1  43.5  38.9  53.5  49.0  45.6  41.3

SEP 13 - SEP 26  2 WKS   9.9   8.8   8.0   6.9   9.9   8.8   8.0   6.9   9.7   8.6   7.7   6.6  10.0   9.0   8.3   7.4
SEP 13 - OCT 10  4 WKS  19.1  17.4  16.0  14.3  19.3  17.4  16.1  14.3  19.2  17.5  16.1  14.4  19.3  17.5  16.2  14.1
SEP 13 - OCT 31  7 WKS  33.9  31.5  29.7  27.5  34.5  31.8  29.7  27.2  33.9  31.3  29.3  26.8  34.1  31.8  30.1  27.9
SEP 13 - NOV 21 10 WKS  46.7  43.2  40.6  37.3  46.9  43.2  40.3  36.8  45.4  41.5  36.6  34.9  46.6  43.1  40.5  37.2
SEP 13 - DEC  5 12 WKS  53.7  49.3  46.0  41.9  53.5  48.9  45.4  41.1  51.9  47.1  43.5  38.4  53.5  49.0  45.6  41.3
SEP 27 - OCT 10  2 WKS   9.9   8.9   8.1   7.1  10.1   9.0   8.2   7.2  10.1   9.1   8.4   7.4   9.9   8.8   8.0   6.9
SEP 27 - OCT 31  5 WKS  24.6  22.9  21.6  20.0  25.1  23.2  21.7  19.8  24.7  22.8  21.4  19.5  24.5  22.7  21.3  19.1
SEP 27 - NOV 21  8 WKS  37.1  34.0  31.7  28.8  37.3  34.1  31.7  28.6  35.9  32.5  30.0  26.8  36.8  33.5  31.0  27.9
SEP 27 - DEC  5 10 WKS  45.1  41.3  38.5  35.0  44.7  40.8  37.9  34.3  43.1  38.9  35.7  31.7  44.6  40.5  37.4  33.5
OCT 11 - OCT 31  3 WKS  14.5  13.3  12.5  11.4  14.8  13.5  12.4  11.2  14.4  13.1  12.1  10.9  14.3  13.1  12.2  11.1
OCT 11 - NOV 21  6 WKS  27.5  24.8  22.8  20.3  27.4  24.6  22.5  19.9  25.9  22.9  20.7  17.9  27.1  24.3  22.1  19.5
Oct 11 - DEC  5  8 WKS  35.7  32.7  30.5  27.7  35.0  31.8  29.4  26.4  33.4  29.9  27.2  23.9  35.2  31.9  29.4  26.2
NOV  1 - NOV 21  3 WKS  14.0  12.6  11.5  10.2  13.6  12.1  11.0   9.6  12.4  10.7   9.3   7.7  13.7  12.2  11.0   9.5
NOV  1 - DEC  5  5 WKS  21.5  19.9  18.6  17.1  20.5  18.7  17.3  15.5  19.3  17.0  15.3  13.2  21.0  19.0  17.4  11.1
NOV 22 - DEC  5  2 WKS   7.2   6.2   5.5   4.6   6.5   5.4   4.5   3.4   6.4   5.3   4.4   3.3   7.0   5.7   4.8   3.6
---------------------------------------------------------------------------------------------------------------------------
     TIME PERIOD             DISTRICT 5              DISTRICT 6               DISTRICT 7              DISTRICT 8             DISTRICT 9
 -------------------      ------------------     -------------------      ------------------      ------------------      ------------------
BEGIN/END DATES LENGTH   50%   65%   75%   85%   50%   65%   75%   85%   50%   65%   75%   85%   50%   65%   75%   85%   50%  65%   75%   85%
---------------------------------------------------------------------------------------------------------------------------------------------------
                                 days                    days                    days                days                   days

SPRING ACTIVITY PERIODS (LAND PREPARATION, PLANT AND EARLY CARE OF CORN AND BEANS)

MAR 29 - APR 25  4 WKS  11.7   9.6   8.0   6.0  11.8   9.5   7.8   5.7  11.8   9.7   8.2   6.2  13.3  11.3   9.6   8.0  11.1   8.9   7.2   5.1
MAR 29 - MAY  9  6 WKS  19.4  16.6  15.1  12.8  19.3  16.8  14.9  12.5  19.3  16.7  14.8  12.3  21.5  19.0  17.2  14.6  18.7  16.1  14.2  11.7
MAR 29 - MAY 23  8 WKS  27.3  24.4  22.2  19.4  27.1  24.2  21.9  19.1  26.6  23.6  21.4  18.6  29.4  26.6  24.5  21.8  26.4  23.3  20.9  17.9
MAR 29 - JUN  6 10 WKS  35.7  33.0  30.9  28.4  36.0  33.1  30.9  28.2  35.3  32.5  30.4  27.7  38.6  35.7  33.6  30.9  35.1  32.2  29.9  27.1
MAR 29 - JUN 20 12 WKS  44.4  41.5  39.3  36.1  45.0  41.7  39.2  36.1  44.6  41.3  38.9  35.9  47.7  44,6  42.2  39.2  44.4  41.1  38.6  35.4
APR 26 - MAY  9  2 WKS   7.6   6.7   6.0   5.1   7.4   6.3   5.5   4.4   7.4   6.0   5.0   3.7   8.1   6.9   6.0   4.9   7.5   6.1   5.2   3.9
APR 26 - MAY 23  4 WKS  15.4  13.8  12.6  11.1  15.2  13.5  12.2  10.6  14.6  12.8  11.4   9.7  15.9  14.2  12.9  11.2  15.1  13.1  11.6   9.7
APR 26 - JUN  6  6 WKS  23.6  22.2  21.0  19.6  23.8  22.1  20.8  19.1  23.2  21.4  20.1  18.4  24.9  23.2  21.8  20.2  23.7  21.9  20.5  18.8
APR 26 - JUN 20  8 WKS  32.5  30.8  29.5  27.9  32.9  30.8  29.3  27.4  32.5  30.3  28.7  26.6  34.1  32.1  30.5  28.6  33.1  30.8  29.0  26.9
MAY 10 - MAY  2  2 WKS   8.0   6.7   5.7   4.4   7.9   6.5   5.4   4.1   7.4   6.1   5.2   4.0   7.9   6.7   5.7   4.5   7.8   6.3   5.3   4.0
MAY 10 - JUN  6  4 WKS  16.3  14.7  13.5  12.0  16.7  14.8  13.5  11.8  16.1  14.3  13.0  11.4  17.1  15.4  14.2  12.7  16.5  14.8  13.6  12.0
MAY 10 - JUN 20  6 WKS  25.0  23.2  21.8  20.0  25.6  23.5  22.0  20.0  25.3  23.1  21.5  19.4  26.2  24.2  22.8  20.9  25.8  23.6  22.0  20.9
MAY 24 - JUN  6  2 WKS   8.3   7.2   6.4   5.4   8.1   7.7   6.9   5.8   8.7   7.6   5.7   5.7   9.1   8.1   7.3   6.2   8.7   7.6   6.8   5.7
MAY 24 - JUN 20  4 WKS  17.1  15.6  14.5  13.1  17.7  16.3  15.3  13.9  17.9  16.2  14.9  13.2  18.2  16.8  15.7  14.3  18.0  16.3  15.0  13.3
JUN  7 - JUN 20  2 WKS   8.7   7.7   6.9   5.8   8.9   7.9   7.1   6.1   9.2   8.2   7.4   6.4   9.1   8.2   7.6   6.8   9.3   8.2   7.4   6.4

SUMMER ACTIVITY (LATE CARE OF CORN-BEANS, HARVEST WHEAT, DOULECROP BEANS, MAKE HAY)

JUN 21 - JUL  4  2 WKS   8.9   7.9   7.2   6.2   9.4   8.5   7.8   6.9   9.5   8.4   7.6   6.6   9.8   8.7   7.9   6.9   9.4   8.2   7.3   6.1
JUL  5 - JUL 18  2 WKS   9.0   8.1   7.4   6.5   9.6   8.7   7.9   7.0  10.2   9.2   8.4   7.5  10.1   9.2   8.6   7.7   9.8   8.8   8.1   7.2
JUL 19 - AUG  1  2 WKS   9.5   8.5   7.7   6.7   9.9   8.7   7.9   6.8   9.9   8.9   8.2   7.3   9.3   8.9   8.2   7.3  10.0   8.8   8.0   6.9
AUG  2 - AUG 15  2 WKS   9.8   9.0   8.3   7.5  10.5   9.5   8.8   7.8  10.3   9.6   9.1   8.5  10.8   9.9   9.3   8.5  10.6   9.6   8.9   8.0
AUG 16 - AUG 29  2 WKS  10.9  10.2   9.8   9.2  11.5  10.7  10.1   9.4  11.3  10.6  10.1   9.5  11.3  10.7  10.2   9.6  11.7  11.0  10.5   9.9
AUG 30 - SEP 12  2 WKS  11.0  10.4  10.0   9.4  11.8  11.1  10.7  10.1  11.1  10.5  10.1   9.5  11.1  10.3   9.7   8.9  11.3  10.4   9.7   8.8

FALL ACTIVITY PERIODS (HARVEST CORN SILAGE-BEANS-CORN GRAIN, PLANT WHEAT, LAND PREPARATION)

SEP 13 - SEP 26  2 WKS   9.7   8.8   8.2   7.4  10.7   9.8   9.1   8.3  10.5   9.7   9.1   8.3  10.6   9.8   9.2   8.4  10.7   9.7   8.9   8.0
SEP 13 - OCT 10  4 WKS  18.6  16.9  15.6  14.0  20.2  18.5  17.2  15.6  20.2  18.7  17.5  16.0  20.2  18.6  17.4  15.9  20.0  18.2  16.9  15.2
SEP 13 - OCT 31  7 WKS  32.9  30.7  29.0  26.9  35.0  32.6  30.8  28.6  35.9  34.1  32.7  31.0  36.6  34.5  32.9  31.0  34.9  32.3  30.3  27.9
SEP 13 - NOV 21 10 WKS  45.0  41.6  39.0  35.8  47.4  43.7  41.1  37.5  48.0  45.1  42.9  40.2  49.0  45.8  43.4  40.4  46.4  42.7  40.0  36.5
SEP 13 - DEC  5 12 WKS  51.3  47.1  44.0  40.1  53.9  49.4  46.0  41.7  54.5  50.5  47.4  43.6  55.5  51.2  48.0  44.0  52.1  47.3  43.7  39.2
SEP 27 - OCT 10  2 WKS   9.5   8.5   7.8   6.8  10.2   9.1   8.3   7.3  10.2   9.2   8.5   7.6  10.2   9.2   8.5   7.6   9.8   8.7   7.8   6.8
SEP 27 - OCT 31  1 WKS  23.6  21.9  20.5  18.9  24.8  22.9  21.5  19.7  25.6  24.2  23.1  21.7  26.4  24.9  23.7  22.3  24.8  22.8  21.3  19.5
SEP 27 - NOV 21  8 WKS  35.3  32.3  30.0  27.0  36.8  33.5  31.0  27.9  37.2  34.3  32.0  29.2  38.2  35.2  33.0  30.1  35.7  32.4  30.0  26.9
SEP 27 - DEC  5 10 WKS  42.5  38.9  36.1  32.7  44.2  40.2  37.2  33.5  44.6  40.8  38.0  34.4  45.7  42.0  39.2  35.7  42.2  38.0  34.9  31.0
OCT 11 - OCT 31  3 WKS  13.9  12.7  11.8  10.7  14.5  13.2  12.2  11.0  15.2  14.1  13.3  12.3  15.9  14.8  14.0  13.0  14.7  13.5  12.5  11.3
OCT 11 - NOV 21  6 WKS  26.0  23.4  21.5  19.0  26.9  24.1  22.0  19.4  27.2  24.6  22.6  20.2  28.2  25.6  23.7  21.3  26.1  23.4  21.3  18.7
OCT 11 - DEC  5  8 WKS  33.4  30.5  28.3  25.5  34.6  31.4  29.0  26.0  34.9  31.9  29.7  26.8  35.9  32.9  30.7  27.9  32.8  29.4  26.9  23.7
NOV  1 - NOV 21  3 WKS  13.1  11.6  10.5   9.2  13.4  11.8  10.6   9.1  13.0  11.3  10.1   8.5  13.0  11.4  10.1   8.6  12.2  10.5   9.2   7.5
NOV  1 - DEC  5  5 WKS  19.7  18.0  16.7  15.0  20.4  18.4  16.8  14.9  19.8  17.6  15.9  13.8  19.9  17.8  16.2  14.2  18.2  15.8  14.1  11.9
NOV 22 - DEC  5  2 WKS   6.3   5.2   4.4   3.5   6.6   5.3   4.4   3.2  6.5    5.2   4.2   2.9   6.5   5.1   4.0   2.7   5.5   4.0   2.9   1.5
---------------------------------------------------------------------------------------------------------------------------------------------------
Good Days Expected
The figures in each column of the table are the minimum number of good fieldwork-days you can expect within the time periods shown on the left at the probability level in the district shown at the too. To understand what these figures mean, let's look at one line of data lifted from Table 1.
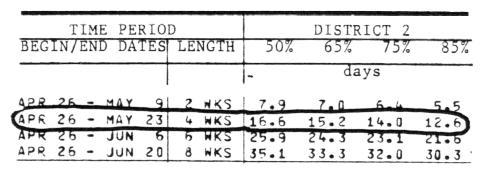
The data say that, during the 4-week April 26-May 23 period in District 2, you can expect at least 16.6 good work-days in 10 years out of 20 years (50% probability column), 15.2 good days in 13 out of 20 years (65% column), 14.0 good days in 15 out of 20 years (75% column and 12.6 days in 17 out of 20 years (85% column). In each case, there may turn out to be more good work-days, but there should not be fewer at the particular probability level.
A review of the work/no-work records for a 4-year period (1974-1977) in District 2 illustrates the difference between expected and actual work-days. As seen above, during the April 26-May 23 period, farmers in that district can expect at least 14 good work-days 3 out of 4 years. The 1974-77 records show that, over those 28 days, they actually had 18 days suitable for fieldwork in 1974, 12 days suitable in 1975, 14 days in 1976 and 21 days in 1977. So there were, indeed, a minimum of 14 good days in three of the years, but less than that in one year.
Activity Periods
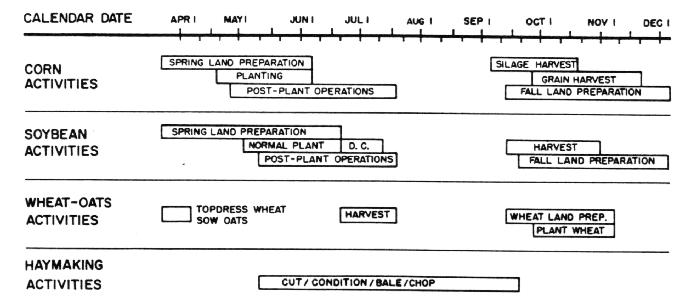
In Table 1, the calendar year (expect 16 weeks in winter) has been divided broadly into spring, summer, and fall fieldwork "activity periods." Within each period are several varying-length time segments (from 2 to 12 weeks) that correspond with the typical range of beginning and ending dates for field operations associated with the major crops grown in Indiana see Figure 1). Already taken into account in the table 5 the fact that not all farmers perform these activities in the same time segments, and the fact that the dates for these activities vary from north to south.
The variable-length time segments are necessary because you cannot simply combine short-period figures to obtain an estimate for a longer period without error. This is because suitable field-days are not uniformly distributed throughout the longer period. To illustrate, let's add the "good-days" figures for three segments (underlined) of an 6-week period in District 1, the 75% probability column.
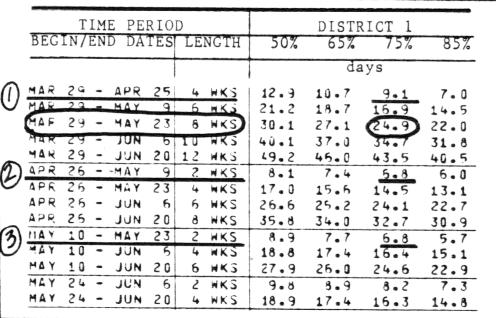
The sum of these three short segments is 22.7 days. Now look at the table value for the same March 29-May 23 period treated as one time segment (circled).
It reads 24.9 days, which is a more reliable figure. Adding shorter-period estimates nearly always indicates ewer good work-days than if you use the longer period estimate. Use the longer-period figures whenever possible.
Reliability of the Work-Day Estimates
The work/no-work data summarized in Table 1 for 1951 - 1978 were collected by official observers throughout the state from the first week in April through the end of November (Or completion of corn harvest). The beginning date of data collection in the spring has been fairly consistent over the years, but the ending date quite variable. During the 1950s, the data often ended in late September or early October. Since about 1960, the ending date has ranged from late October to late November. Some years the records extended into December and even January.
This means that you can place greater confidence in the table values prior to mid-September (which are based on 27-26 years of information) than you can in those after mid-September. The work-days figures shown for the November 22-December 5 period are based on only 15 years of information. Still, 15 years is better than having only 5-10 years on which to make estimates.
The probability levels you select in Table 1 will depend on your risk preference and other factors associated with your particular farming operation. For instance, if an equipment sizing decision was to be based on the number of good days from the 50% probability column, that equipment would be adequate to complete its task within the period desired only half of the time; the other halt of the time, it would be undersized. This is probably not profitable enough for most commercial farms.
Probability levels in the 65-85% range are generally used for machinery sizing purposes, although specific guidelines or rules for this are difficult to document. Crop producers tend to use the low end of the range (65%) for tillage and pest control equipment, and the high end (85%) for planting and harvesting equipment decisions.
Livestock producers, on the other hand, might consider using the higher probability for all of their field equipment decisions, because livestock activities often limit the hours of fieldwork possible on good days. The higher probability columns may also be more appropriate for small-acreage and part-time farmers.
When deciding what probability level, remember that the higher the probability, the fewer the minimum number of expected good work-days. A high probability suggests the use of larger equipment, which will be oversized in many of the years. But with oversized equipment comes greater assurance that the field operation can be completed in the desired time period. (Or stated another way, there is less chance of an operation not being done when you want it to be.)
The work-days figures in Table 1 are district-wide averages, resulting from the following collection and interpretation procedures.
At various locations within each district, official observers for the Indiana Crop and Livestock Reporting Service judged the field conditions for each day as either "suitable" or "not suitable" for the type of fieldwork typically performed at that time of year. If half of the observers in a district declared a day suitable and half declared it unsuitable, one-half of a fieldwork-day was registered for the entire district on that particular date.
With this "averaging" technique in mind, you may want to slightly modify the table estimates if your soils are either better drained or more poorly drained than the average soil in your crop reporting district. Do this by adding (or subtracting) a certain number of days (or portions of days) or a certain percentage as you decide, such as 10-15 percent.
Also, the table values are for a 7-day work week. If you typically work a 6-day week, reduce the minimum number of good days by 13-15 percent; if a 5-day week, reduce by 26-30 percent.
The term "daily field capacity" is defined here as the number of acres that, with a given probability, you either can or would like to complete per day. Calculating this figure enables you to then determine the machinery capacity you will need in order to complete a certain total acreage within a desired time period.
The following steps show how to use Table 1 to determine minimum daily field capacity for any given crop production activity (see Worksheet page 6).
The examples on pages 7 and 6 illustrate how daily field capacity is determined for the specific field operations of planting, harvesting and chisel plowing. The "worksheet" on which these example calculations were done is the same as that provided below for your use.
          Crop Reporting District in which my farm is located: ______


A. Type of field operation                              _______ _______ _______

B. Date I want to begin                                 _______ _______ _______

C. Date I want to finish                                _______ _______ _______

D.  Desired probability that I will finish by
    the date selected (50%, 65%, 75% or 85%)            _______ _______ _______

E. Number of good days expected (from table, using
   D to determine column in your district, B and C
   to determine line)                Spring activity:   _______ _______ _______

                                      Summer activity:  _______ _______ _______
   (enter zero
   when appropriate)                    Fall activity:  _______ _______ _______

F. Total good days expected (spring + summer + fall)    _______ _______ _______

G. Soil drainage adjustment                             _______ _______ _______
   If your soil drainage is "average" (typical of
   the whole District) , enter  zero in the blank.
   If "better", enter + _______ % x F (an increase)*
   If "poorer", enter - _______ % x F (a decrease)*

H. Total good days after drainage adjustment.. (F + G)   _______ _______ ______

I. Work-week adjustment                                  _______ _______ _______
   If you work 7 days per week (basis for the
   table values) , enter zero in the blank.
   If 6 days, enter -  ________ % x H (a decrease)*
   If 5 days, enter -  ________ % x H (a decrease)*

J.  Total good days after work-week adjustment.(H - I)   _______ _______ _______

K.  Number of acres to be completed                      _______ _______ _______

L.  Minimum required field capacity, acres/day (K  ÷  J) _______ _______ _______


*See adjustment suggestions under "When and How to Modify the Work-Day
Estimates."
Situation. A hog producer in Crop Reporting District grows 350 acres of corn and soybeans on poorer-than-average drained soil. He plans to begin planting about April 26 and wants to Know with high probability (85%) that he will finish by May 23, while working a 7-day week.
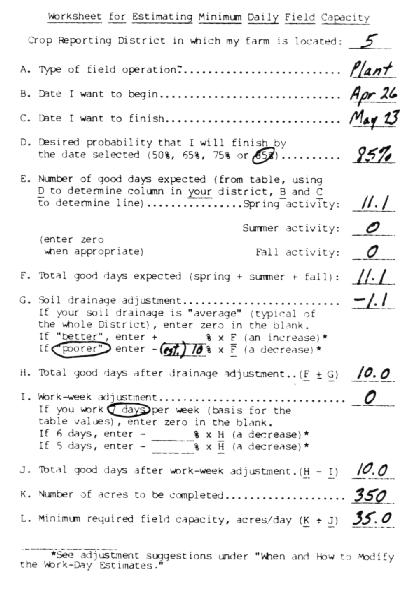
Summary. The minimum field capacity for planting is 35.0 acres per day. With this planting capacity, he could expect to finish by May 23 in 17 years out of 20. In many of these 17 years, planting would probably be completed prior to May 23, since the 35 acres per day is based on the minimum number of good days expected. In 3 of the 20 years, he would not be done by May 23.
Field Capacity for Harvesting
Situation. A cash grain farmer on average-drained soil in District 9 harvests 300 acres of corn and 300 acres of soybeans each fall (some of the beans are double-cropped after wheat). He would like to start harvesting beans about September 27 and be finished with both beans and corn by November 21 at least 3 years out of 4 (75% probability), while working a 6-Day week.
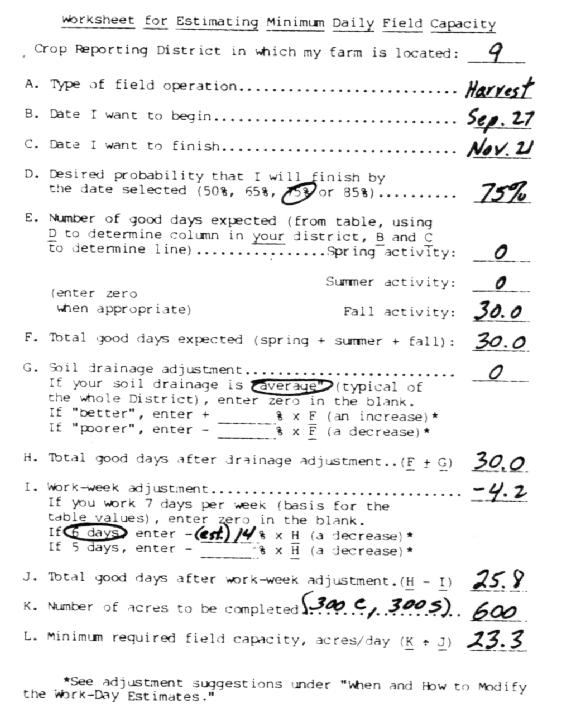
Summary. The minimum daily harvest capacity required is found to be 23.3 acres, which, of course, also sets the minimum daily transporting, marketing or on-farm drying and handling capacities. At this harvest rate, he could expect to be finished by November 21 or earlier in 3 out of 4 years. In the other year, some harvesting would likely go on after November 21
Field Capacity for Chisel Plowing
Situations. Farmers A, B and C, all living in widely separated parts of District 1, each have 450 acres of and that they annually chisel plow. Farmer A tall chisels his average-drained soil beginning November 1 while harvest is still going on, and hopes to finish (with a 65% probability level) before bad weather sets in around December 5. Farmer B tall chisels his average-drained soil only when harvest is completed (about November 21), quits when winter weather forces him to, then finishes in the spring, hopefully before April 26 at least 75 percent of the time. Farmer C, who spring chisels because his light, sandy soil is subject to serious wind erosion during winter months, would like to finish by April 25 in 17 of 20 years (85% probability. Each farmer works a 7-day week.
Note that a higher probability has been assumed in each succeeding case. This is because the risk of being untimely with later field operations (including planting) is successively greater if the chiseling job isn't completed within the desired time period. For instance, if Farmer A doesn't get done in the tall, he can still Spring chisel; but if Farmer C isn't done by April 25, chances are his planting schedule will be delayed
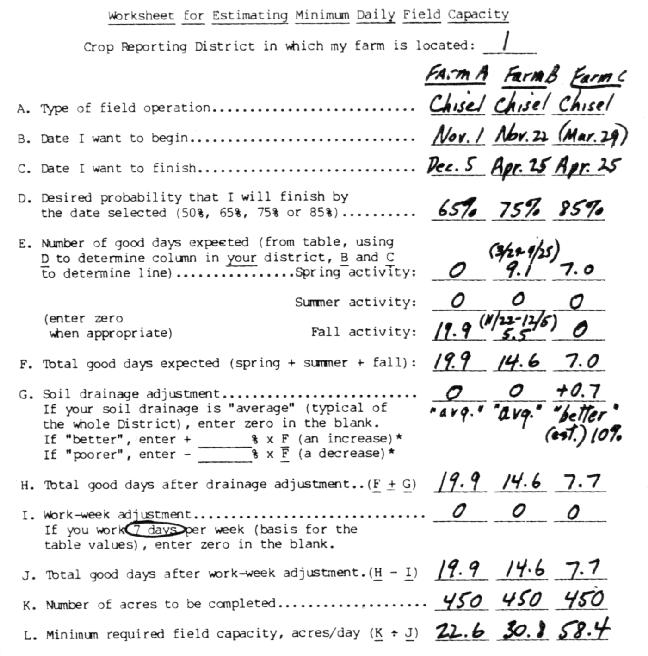
Summary. The calculations reveal that Farmer d, needs a minimum chiseling capacity of 22.6 acres per day to be finished by December 5 In 13 years out of 20; that Farmer B need a minimum daily capacity of 30.8 acres per day to complete plowing by April 25 in 3 years of 4; and that Farmer C needs to chisel 58.4 acres a day to be done by April 25 with 85 percent assurance. But all three farmers may, in fact, elect to use the same size chisel plow. (see discussion below).
To accomplish their 450-acre chisel plowing jobs in the time periods desired and at the probabilities specified, the minimum daily chiseling capacities are quite different for Farmers A, B and C in the preceding example. The amount and/or size of equipment each must have to meet his calculated minimum acres-per-day requirement depends on a number of factors. These include such things as: hours of operation per day, field speed, field efficiency, including equipment downtime (a function of maintenance and servicing procedures), transporting equipment to, from and between fields, etc.-- all of which occur on good work-days.
The best source of information for predicting time available to complete field operations is your own records. If you have not yet developed such records, then the data in Table 1 can be useful in estimating field operation time requirements, which, in turn, provide the basis for individual machinery sizing decisions. The table presents district-wide averages and should be modified, when appropriate, to reflect your soils and conditions.
Remember that the acres-per-day field capacities calculated in the worksheet from the "expected good workdays" figures represent the minimum needed to accomplish your desired field activity goals at the probability levels selected. Having larger equipment than that required to meet minimum field capacities provides a margin of safety. The trade-off, of course, is apt to be a higher machinery investment.
A sizing exercise for an individual machine or implement, like that presented here, provides valuable information and insight into the way alternative machinery decisions can affect how you operate. But don't overlook the interdependence of machinery operations. To evaluate the performance of your entire machinery system, consider using one of the many helpful computer programs now available. Such programs can be important long-range planning tools for investigating "machinery mix" decisions.
NEW 8/83
Cooperative Extension work in Agriculture and Home Economics, state of Indiana, Purdue university, and U.S. Department of Agriculture cooperating; H. A. Wadsworth, Director, West Lafayette, IN. Issued in furtherance of the acts of May 8 and June 30, 1914. The Cooperative Extension Service of Purdue university is an affirmative action/equal opportunity institution.