Pulaski County Resources
What We Do
We improve lives and livelihoods by delivering tested and trusted educational resources. The Cooperative Extension Service is one of the nation's largest providers of scientific research-based information and education. It's a network of colleges, universities, and the U.S. Department of Agriculture, serving communities and counties across America. The Purdue Extension focuses on: Agriculture and Natural Resources, Human and Health Sciences, Economic and Community Development and 4-H Youth.
Contact Us
Purdue Extension Pulaski County
ssporled@purdue.edu
County Building Room 120
125 S Riverside Drive
Winamac, IN 46996
(574) 946-3412
#PurdueDayofGiving is less than a month away! Save the date to help support your local #PurdueExtension program and @Indiana4-H on April 24th!
2024 AREA 8 & 9 4-H Camp
4-H Camp

2024 Camp Dates: June 5-7 Location: Camp Tecumseh 12635 W Tecumseh Bend Road Brookston, IN 47923
Learn more about 4-H CampIt's that time of year again ...
2024 4-H Royalty & 2024 Pork Shack Scholarship

... time for 4-H Achievement Royalty and Pork Shack Scholarship applications! 4-H Achievement Royalty is for any Pulaski County 4-H member that is in 9th-12th grade and has been in 4-H at least 5 years. The Pork Shack Scholarship is...
2024 4-H Achievement Royalty & Pork Shack Scholarship Applications4-H Academy June 12 - 14, 2024
4-H Academy June 12 - 14, 2024

4-H Academy is a program held at Purdue University which offers hands-on, exciting opportunities to dive deep into a 4-H’ers subject of choice. Participants in grades 9-12 learn from professors, graduate students and other experts in their...
4-H Academy ... Learn More Here!State 4-H Band June 22-24, 2024
State 4-H Band June 22-24, 2024
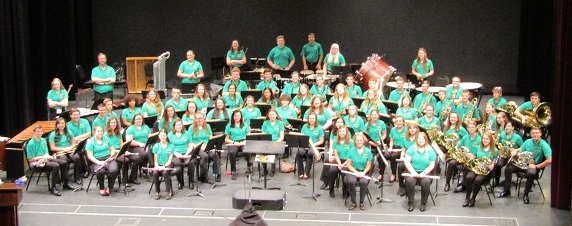
The State 4-H Band workshop is three days in length. Youth will improve their instrumental skills as they prepare for a concert band performance Monday evening during 4-H Round-Up. Any youth who has completed grade 9, 10, 11, or 12 may...
State 4-H Band ... Learn More Here!State 4-H Chorus June 22 - 25, 2024
State 4-H Chorus June 22 - 25, 2024
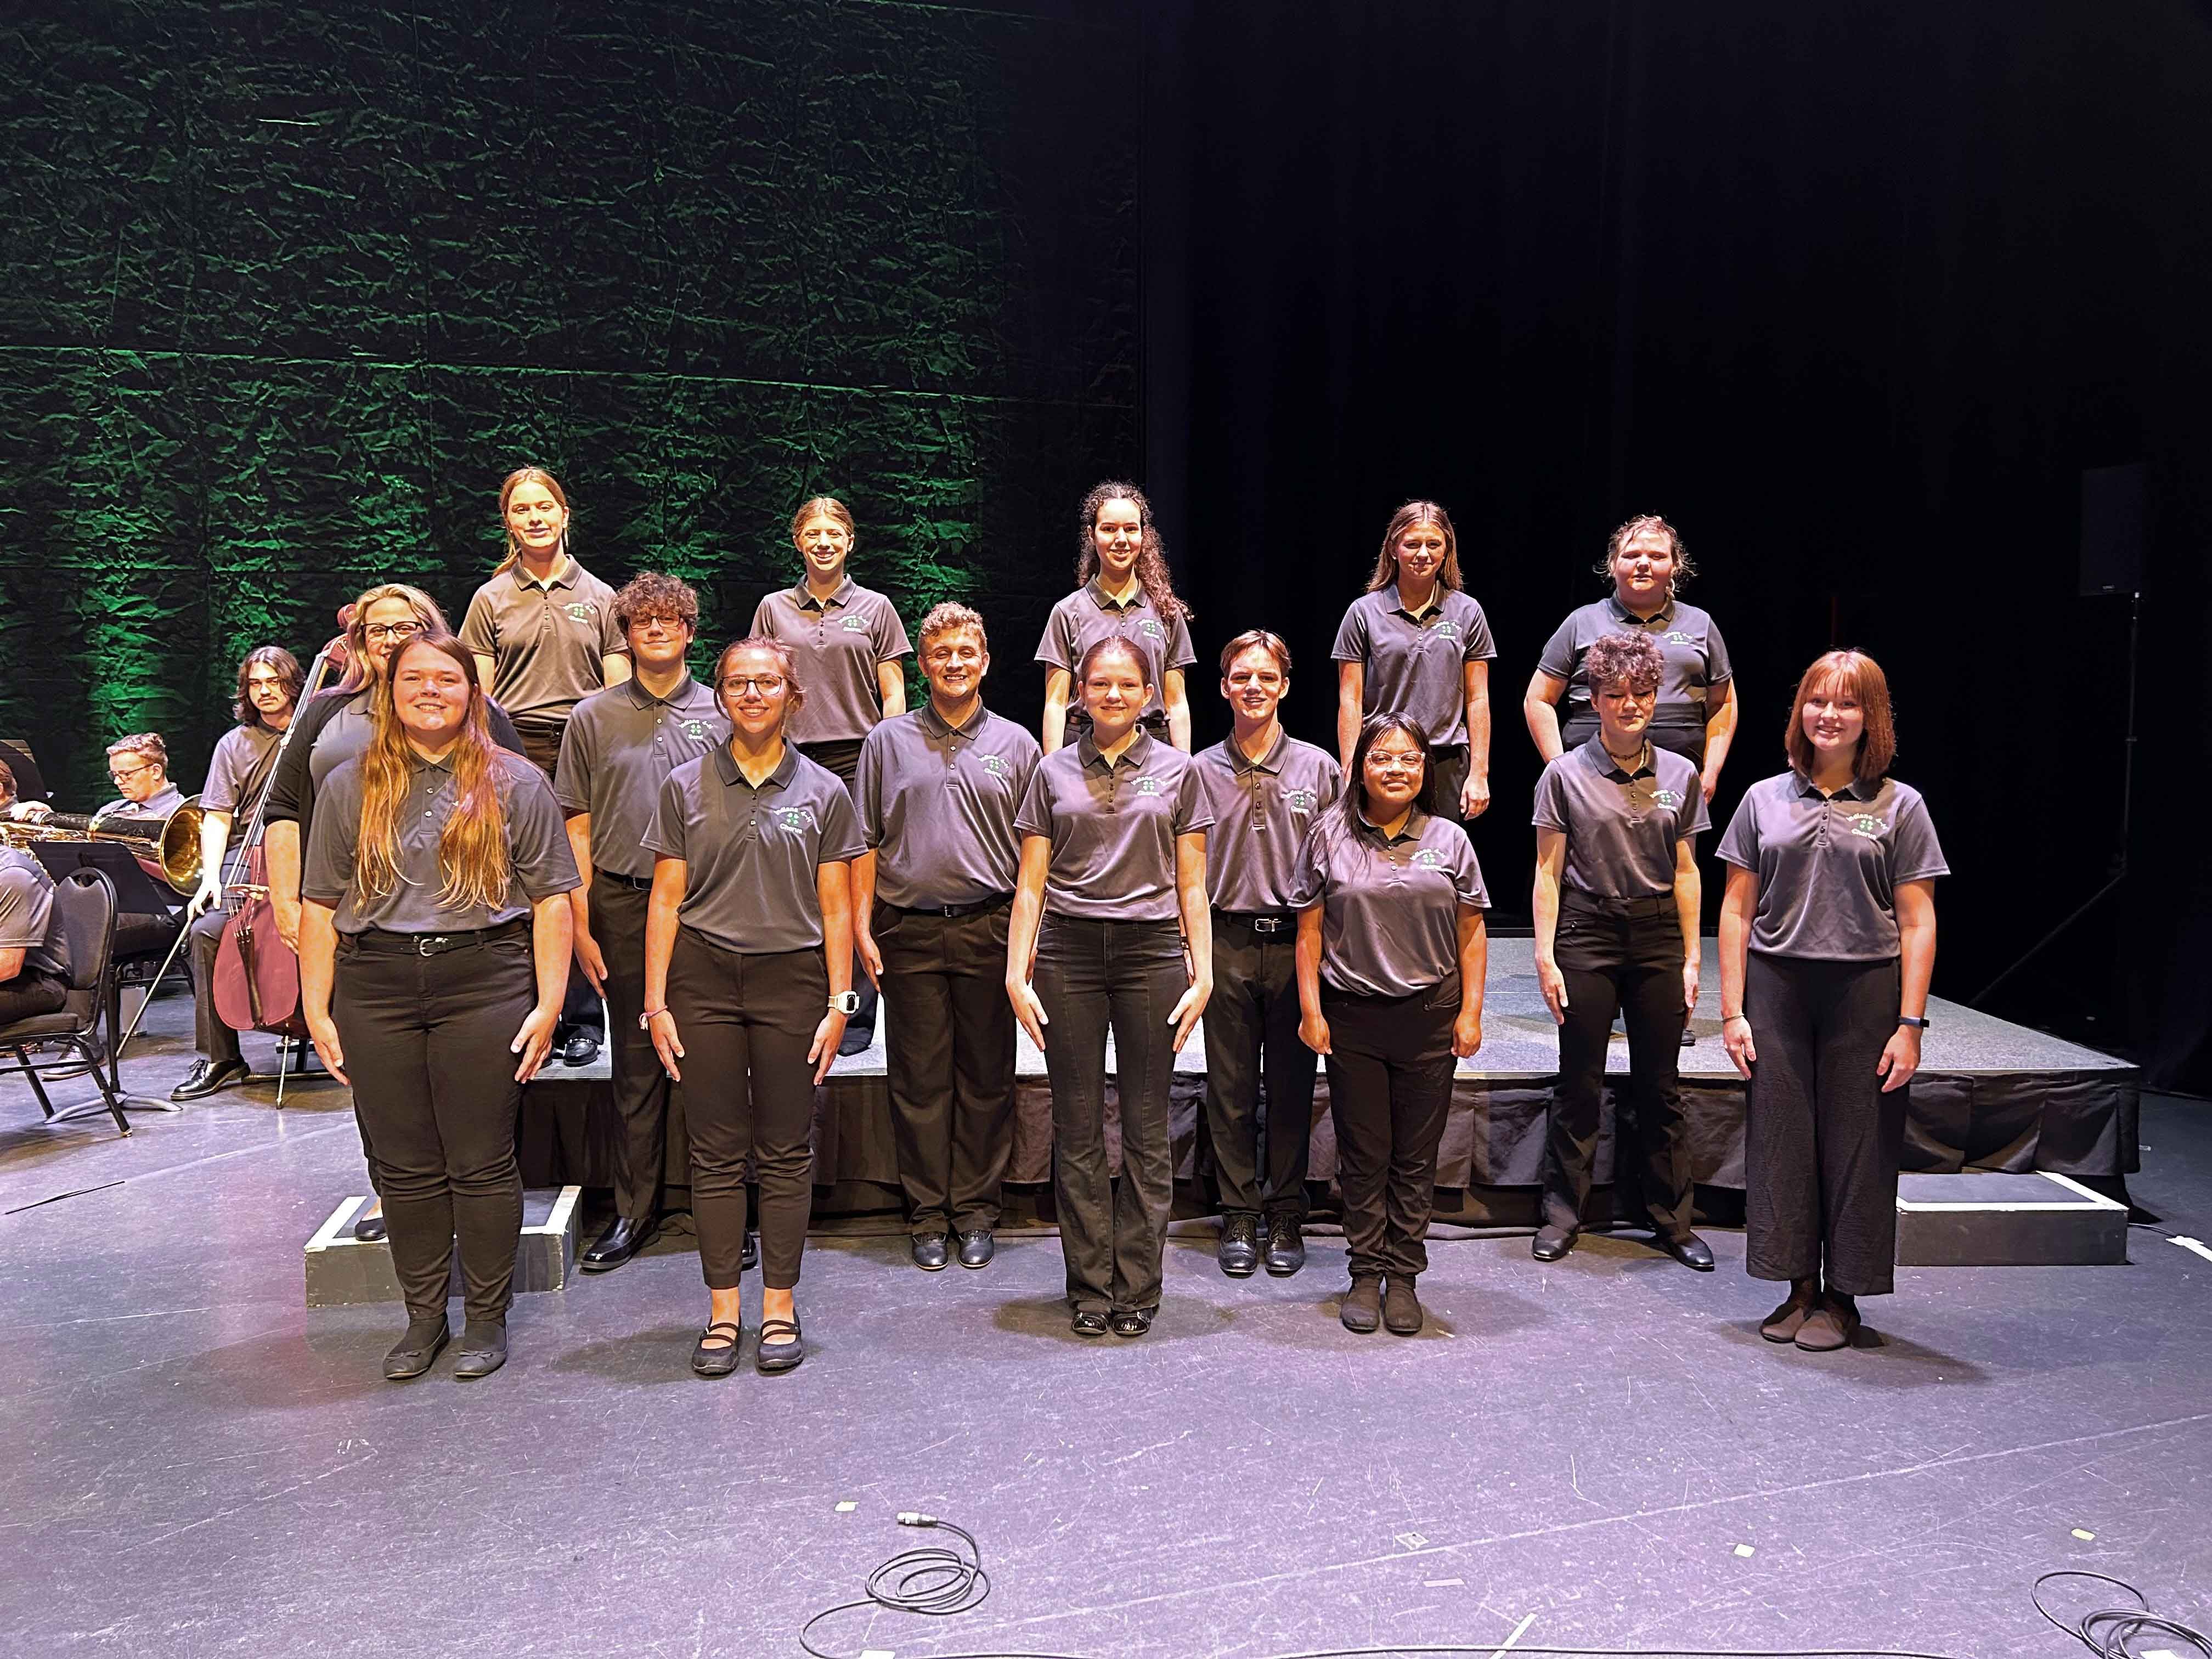
The State 4-H Chorus workshop is four days in length. Youth will improve their vocal and choreography skills as they prepare for a show choir performance Tuesday evening during 4-H Round-Up. Any youth who has completed grade 9, 10, 11, or...
State 4-H Chorus... Learn More Here!4-H Round-Up June 24 - 26, 2024
4-H Round-Up June 24 - 26, 2024

4-H Round-Up is an opportunity for youth who have completed grades 7, 8, and 9 to visit Purdue University’s campus and explore a variety of career paths by attending hands-on classes created just for Round-Up attendees. Supported by 4-H...
4-H Round Up ... Learn More Here!State Fair Exhibit Hall Worker Opportunity
State Fair Exhibit Hall Worker Opportunity
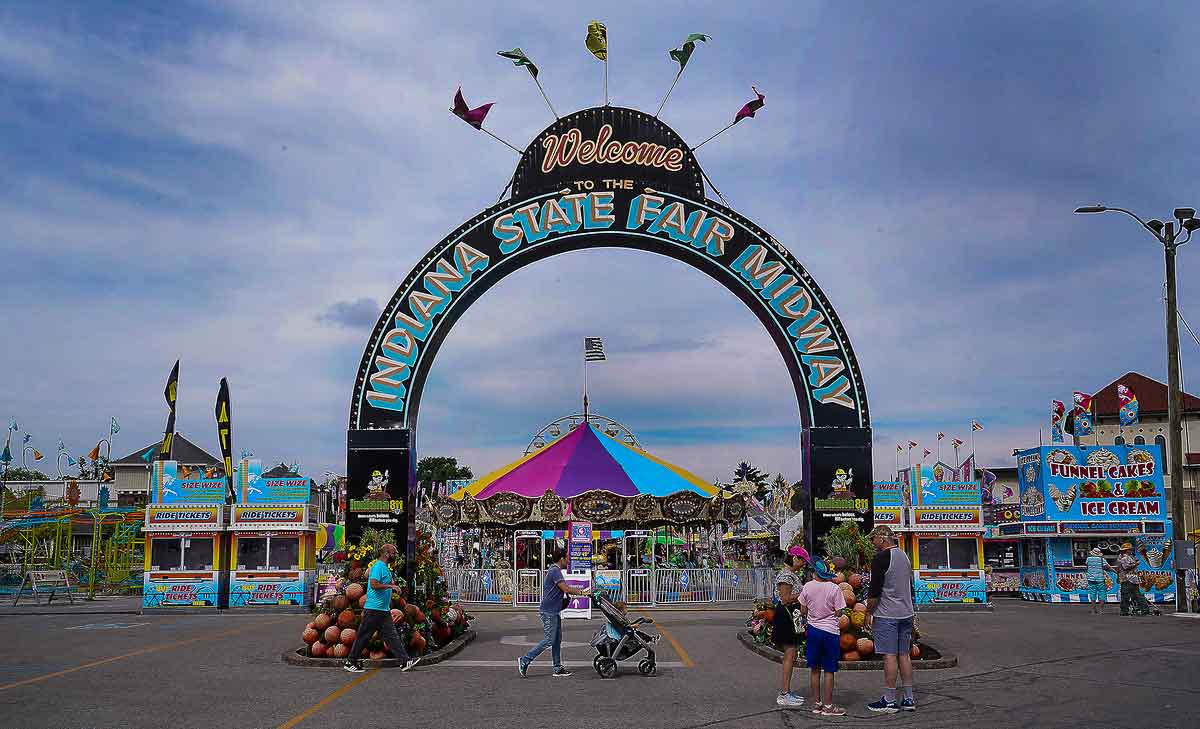
State fair exhibit hall worker opportunity is available to any youth aged 14 thru college-age when beginning seasonal temporary employment. This is a paid opportunity.
State Fair Exhibit Hall Worker OpportunitySupport 4-H in Pulaski County
Support 4-H in Pulaski County

Become a 4-H Supporter or 4-H Sponsor! Click the link below to learn more about how you can support 4-H.
Become a 4-H Supporter/Sponsor2024 Pulaski County 4-H Project Handbooks
2024 Pulaski County 4-H Project Handbooks
You can find all of our 4-H project handbooks here. They will be added as the books are updated for the year.
Read MorePulaski county 4-h clubs...
Pulaski County 4-H offers township clubs and project-based clubs. Township clubs are designed to keep you informed of all that is happening. These groups also help to build a sense of belonging and a 4-H community. Project-based clubs focus on a specific project area such as Horse & Pony, Dog, and Shooting Sports. These clubs gear their meetings toward learning about that specific project. We encourage people to choose a club based on location and time of meeting that best fits their schedule.
Find your Pulaski County 4-H Clubs here!Go to Pulaski County 4-H Club meetings!Shooting Sports 4-H Club Information2024 Shooting Sports 4-H Club Meetings & Range Dates

